Design for Observability & Visibility
Chapter Info
Calculating... Writing Progress: 60%
Observability is the ability to understand a system from the evidence it continuously produces. Signals become evidence when they can explain what happened, where, and why. Modern software systems are distributed, asynchronous, and constantly changing, which makes failures harder to diagnose. Visibility makes system health and behavior accessible; observability goes further by turning raw signals into evidence teams can use to explain what is happening and why. This chapter explains what evidence matters, how to structure it, and how to build systems that are diagnosable by design—so teams can detect issues early, investigate quickly, and improve reliability over time.

Foundational Concepts
What You Can't See, You Can't Control [See to Control]
What you cannot see, you cannot understand or control. This is true of any complex system, whether technical, organizational, or physical. Without clear evidence of its internal state and behavior, decisions rely on assumptions, problems remain hidden, and improvement becomes guesswork.
The Opacity of Modern Systems [System Opacity]
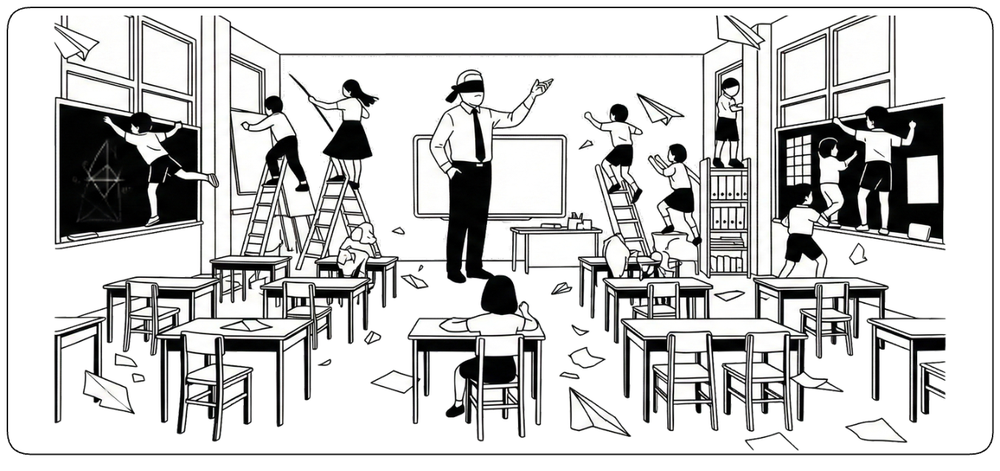
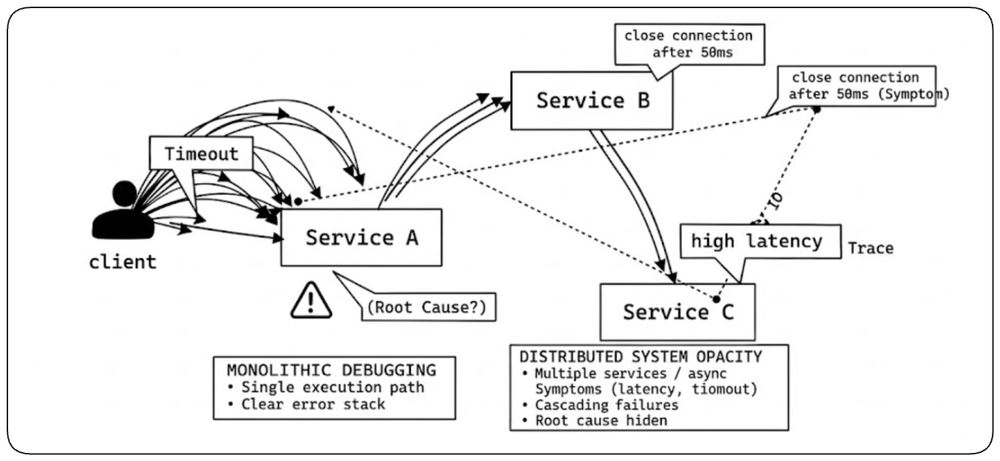
Modern systems hide causality. A visible failure may be only the final symptom of a longer chain involving several services, queues, and dependencies. Observability reconstructs that chain, turning scattered symptoms into a traceable explanation.
Monitoring vs Observability: A Fundamental Difference [Monitoring vs Observability]
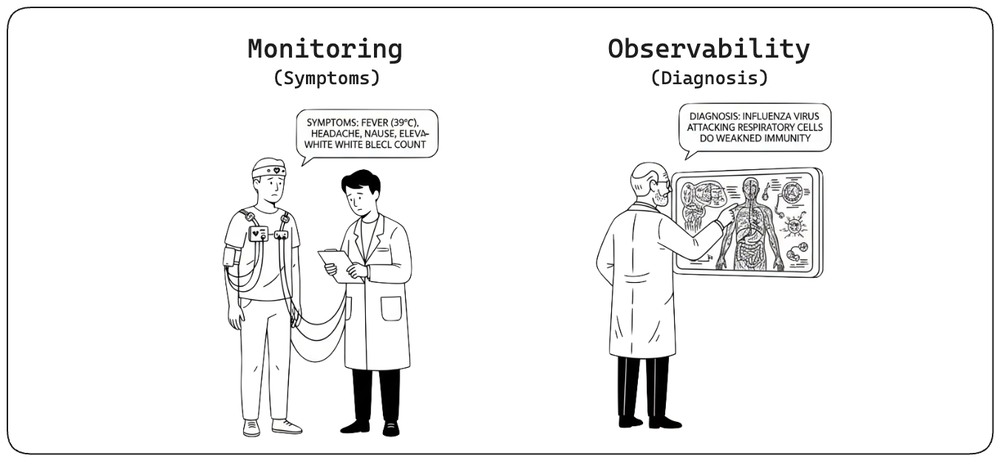
Monitoring answers "Is something wrong?" by detecting known failure modes using predefined thresholds and alarms. It focuses on alerting when metrics cross boundaries or expected patterns are violated. Observability answers "What is happening and why?" by enabling investigation of both known and unknown failure modes through enough signals and context to explain system behavior. In short: monitoring provides alarms; observability provides understanding.
Why Observability Exists: Failure is Normal [Failure is Normal]
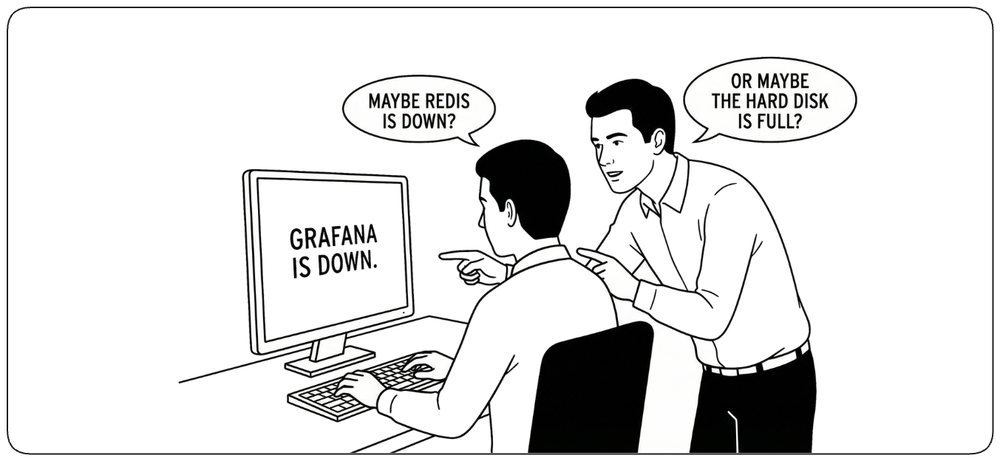
Observability exists because failure is normal. In complex systems, the question is not whether something will break, but when, where, and how. Failures often appear as ambiguous symptoms—a latency increase, partial outage, failing dependency, or unreliable user journey—rather than a clear error. Observability gives teams the evidence to understand what happened, where, why, and what changed, turning incidents from guesswork into investigation and learning.
Design Principles
Observability Starts at Design Time, Not Incident Time [Design-Time Observability]
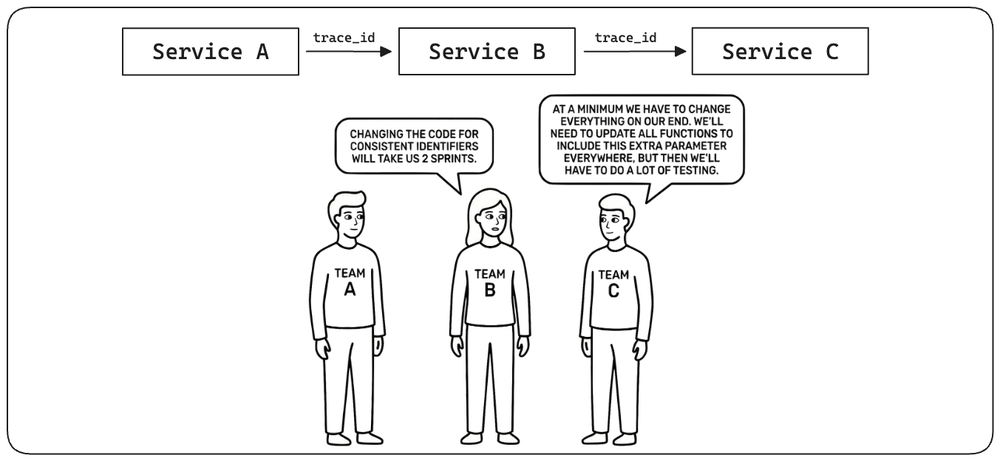
Observability must be designed before incidents occur. Systems should expose clear boundaries, explicit workflows, consistent request and trace identifiers, and stable event semantics from the start. Without this foundation, teams discover missing instrumentation only when they need it most, turning incident response into a costly game of catch-up.
The "Question-First" Principle [Question-First Observability]
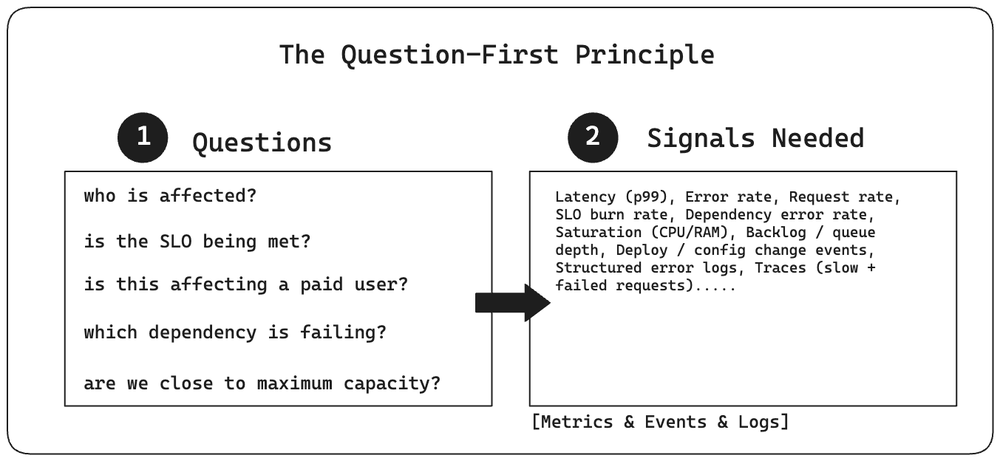
The “Question-First” Principle means defining the questions you need to answer before deciding what data to collect or display. Instead of saying, “We have these logs and metrics, let’s put them on a dashboard,” ask: “What decisions must we make during an incident, and what evidence is needed to support them?” This shifts observability from accumulating data to instrumenting systems deliberately around the questions that matter most.
Without Context, Data is Just Noise [Context Matters]
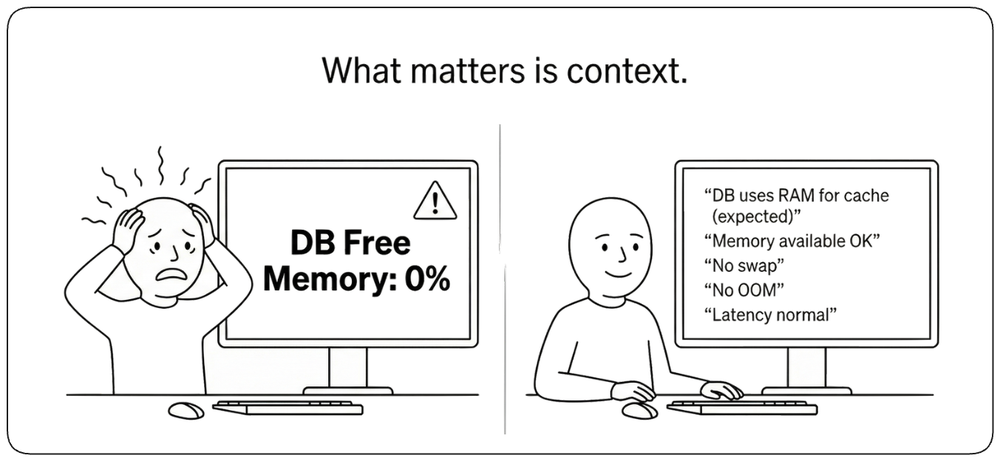
Raw data is noise. Context is understanding. A log line saying “500 Internal Server Error” tells you almost nothing on its own. Attaching correlation identifiers, deployment version, environment, dependencies, and user impact turns isolated signals into evidence that can explain what happened.
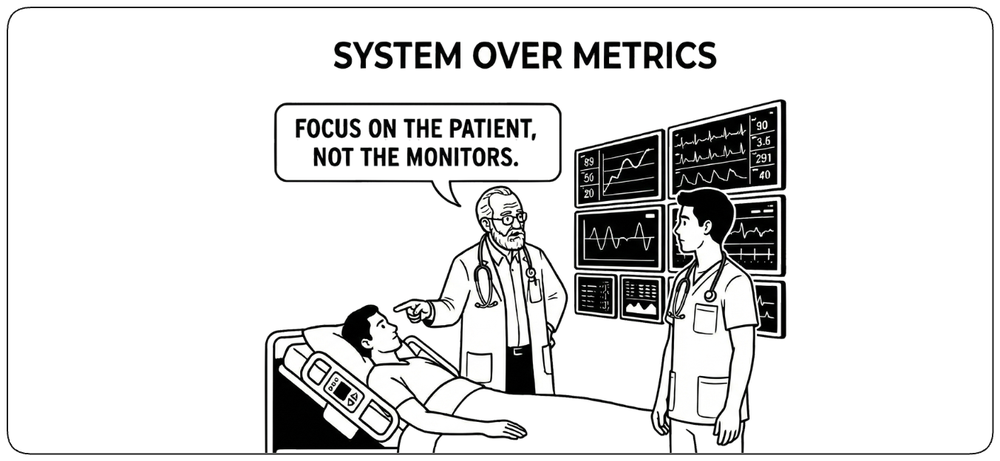
Focus on the Patient, Not the Monitors [Patient Over Monitors]
Metrics can be misleading. A dashboard showing green numbers doesn't guarantee that users are actually experiencing a working system. The priority is understanding whether the system functions correctly for its users, not whether the metrics look good. Focus on user-facing outcomes: are requests completing successfully? Are users able to accomplish their goals? Are critical workflows operational? Metrics are tools to answer these questions, not goals in themselves. When metrics and reality diverge, trust reality.
You Can Only Improve What You Measure Correctly [Measure to Improve]
Improvement depends on accurate measurement. Teams can only validate a change, compare alternatives, or detect regressions if the measurements reflect real user experience and system constraints. Good metrics turn engineering into an evidence-based feedback loop.

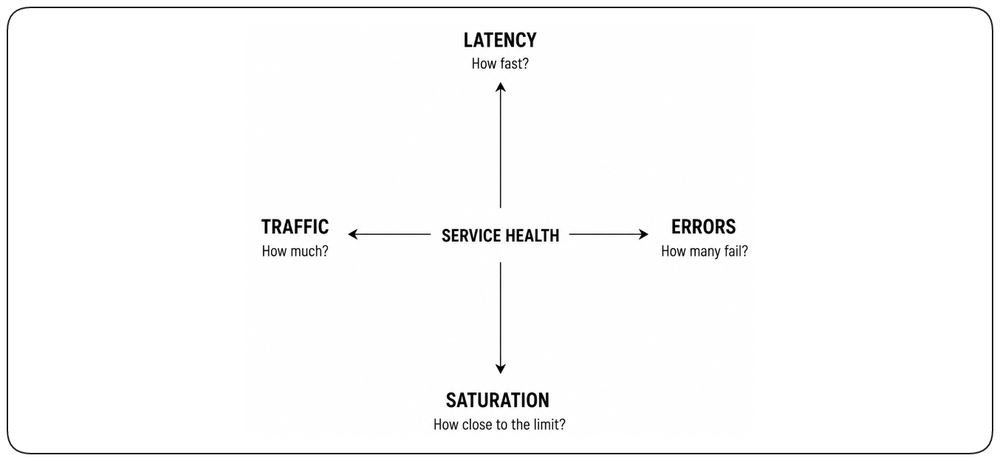
The Four Golden Signals: What Users Actually Feel [Golden Signals]
Google's SRE practice distills the observability of any user-facing service down to four signals: Latency (how long a request takes), Traffic (how much demand), Errors (how many requests fail), and Saturation (how full the system is). These four cover the essential user experience without drowning teams in metrics. They map naturally to Service Level Indicators (SLIs)—measurable quantities you commit to—and Service Level Objectives (SLOs)—the target values you promise to hold. Together they translate technical performance into a language shared by engineers, product, and users.
Learn More
Chapter: Design for High Availability — see "SLIs, SLOs, and SLAs".
Dashboards Must Answer a Real Question [Actionable Dashboards]
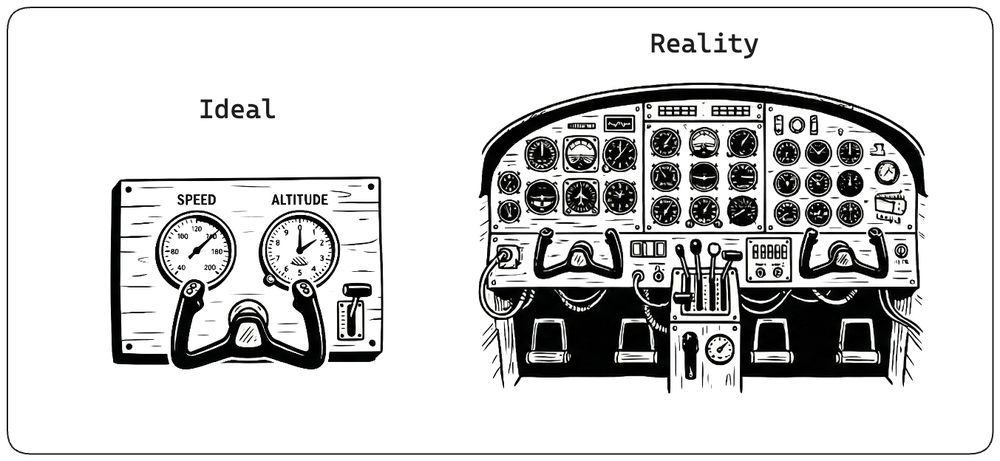
A dashboard exists to answer questions, not to look impressive. Every metric shown should map to a decision: is the user impacted, is a component saturated, did something change. Effective dashboards focus on actionable metrics—error rates, latency percentiles, business transaction success, dependency health. Metrics that don't drive a decision belong in logs or archives, not on a shared screen.
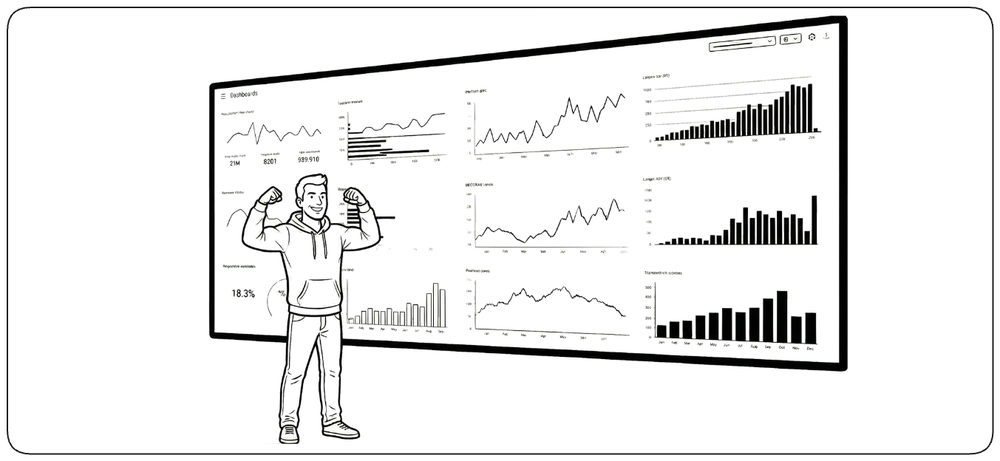
Every Dashboard Is an Opportunity to Automate [Automate First]
Each new dashboard is a signal that a problem needs a human to intervene. Whenever possible, invest in automation that resolves the problem before a human has to look: self-healing services, auto-scaling, automated remediation scripts. Dashboards remain useful for understanding and investigation, but the goal is to replace watching with acting. The best dashboard is the one nobody has to watch.
Benefits of Observability
Effective observability improves incident response, delivery speed, scalability, and reliability by replacing assumptions with evidence.
Faster Incident Resolution [Faster Resolution]
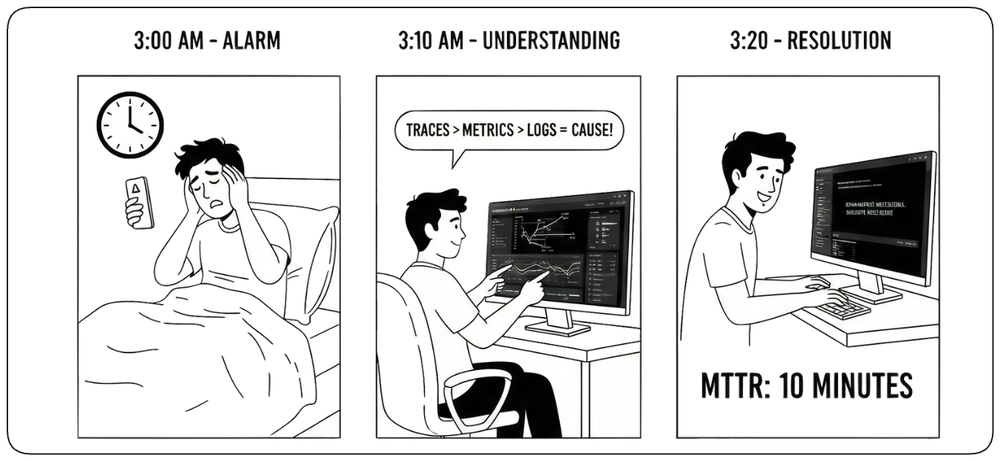
When something breaks, observability replaces guesswork with evidence. Traces show where requests fail, metrics reveal the scope of impact, logs explain what happened, and shared context connects the signals. Instead of trying random fixes or restarting services blindly, teams can follow the evidence toward the most likely cause. They can localize the problem, understand who is affected, and recover faster—reducing user impact and operational stress.
Safer Change [Safe Change]
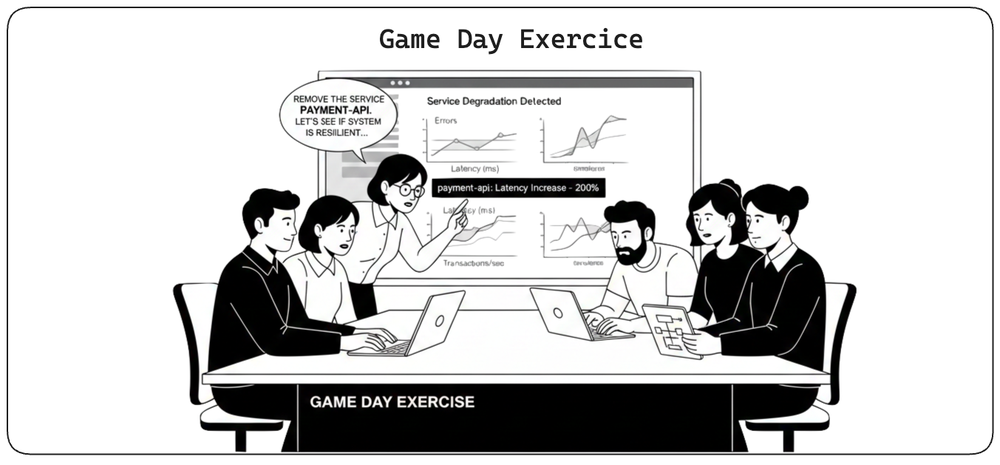
Observability makes change safer by showing its effects quickly. If a release increases errors, latency, or failed user journeys, teams can identify the change, measure its impact, and roll back or fix it with confidence. This feedback loop supports faster delivery, more frequent deployments, and experimentation without turning every change into a blind risk.
Confident Scaling [Confident Scaling]
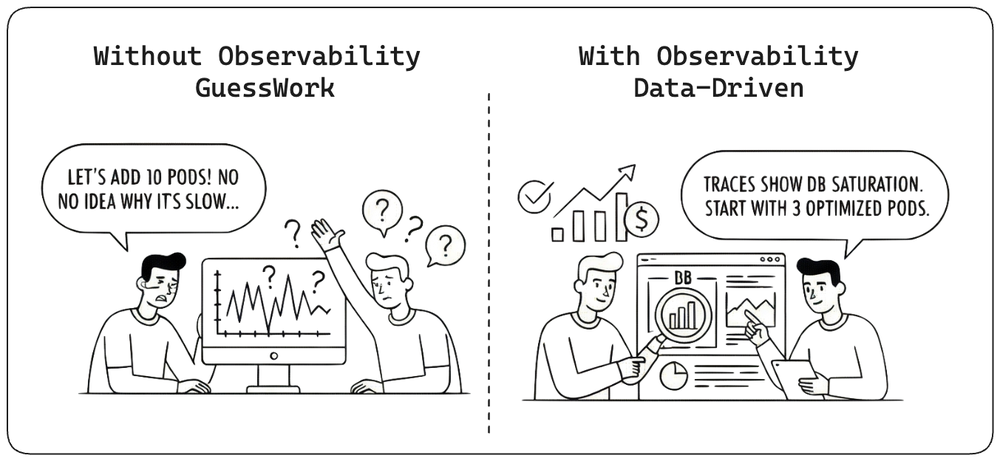
Scaling is risky when the bottleneck is unknown. Observability reveals where latency accumulates, what saturates first, and which dependency limits throughput, so teams scale the actual constraint instead of adding capacity blindly. This reduces overprovisioning, controls cost, and turns scaling from guesswork into a targeted decision.
Higher Reliability Without Heroism [Reliability Without Heroes]
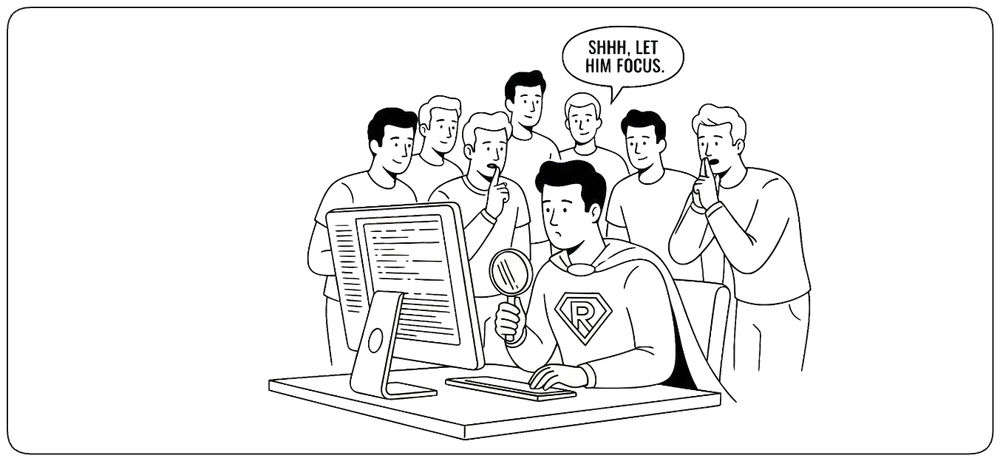
Without observability, reliability depends on a few experts debugging under pressure. With clear signals, documented procedures, and shared operational knowledge, diagnosis becomes repeatable and teams can respond effectively even when those experts are unavailable. Reliability should improve through process and learning, not heroics.
The Four Pillars of Observability [The 4 Pillars]
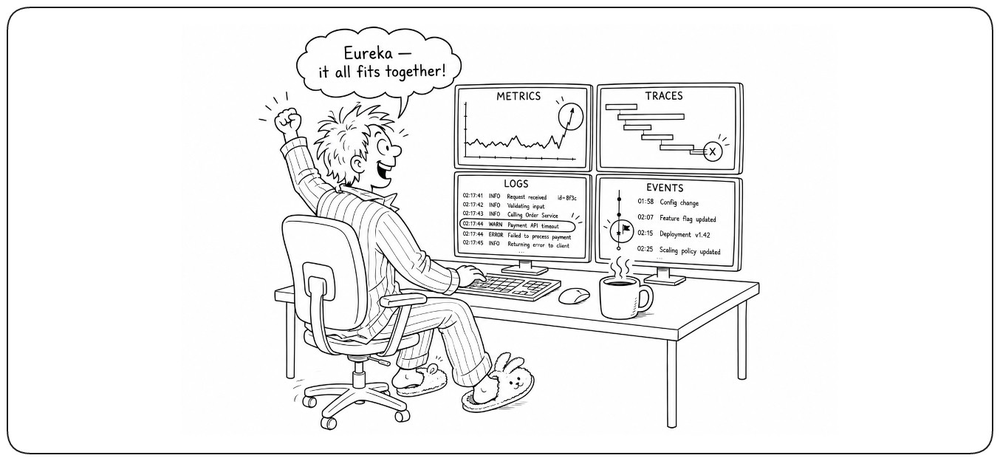
Observability relies on four complementary signals in this chapter: metrics, traces, logs, and events. Each answers a different class of questions—symptoms, where, why, and what changed.
Metrics: Quantitative System Measurements [Metrics]
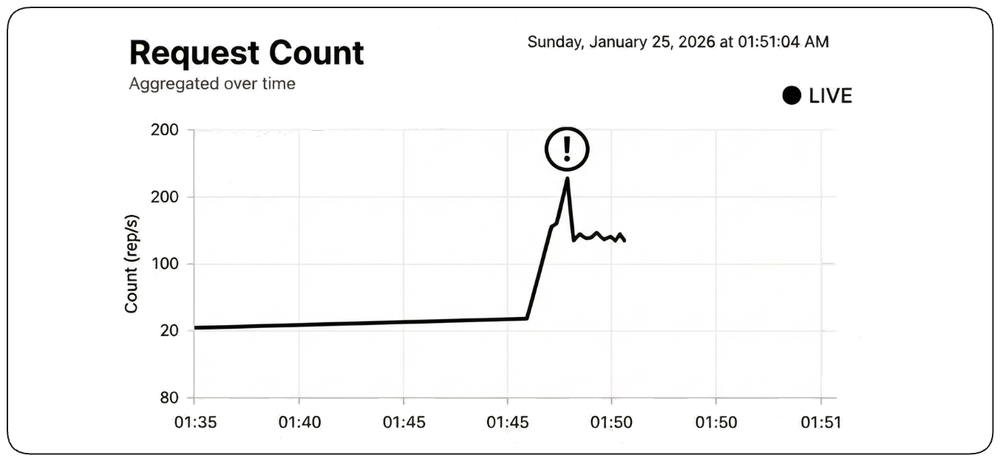
Metrics are aggregated numbers over time (rates, latency, saturation). They are great for spotting trends and detecting drift away from normal. Metrics rarely explain "why" on their own, but they reliably show where to start looking.
Tracing: Following Requests Through Distributed Systems [Tracing]
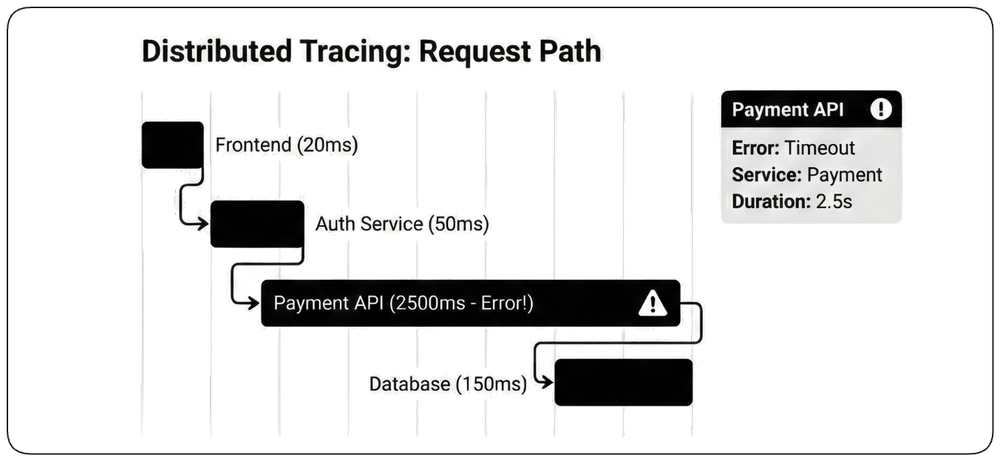
Tracing answers "where did the time go?" and "where did it fail?" by showing the path of a request across services. In distributed systems, it is often the fastest way to identify the specific hop that introduced latency or errors.
Logging: Detailed Event Records [Logging]
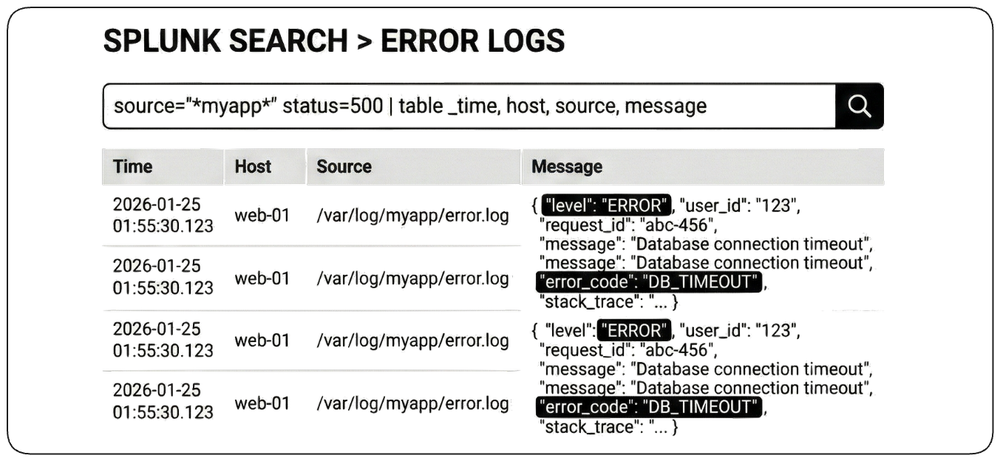
Logs provide the narrative: what happened, with enough detail to explain failures. The goal is not volume, but clarity—structured, searchable records that can be correlated with traces and deployments.
Events: Significant State Changes [Events]
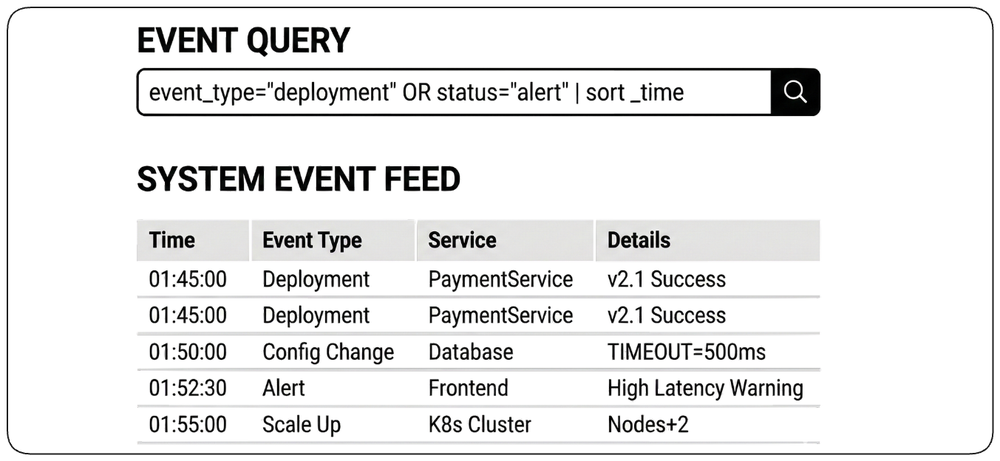
Events capture significant state changes such as deployments, configuration updates, feature flag changes, or workflow milestones. Unlike logs, they act as structured timeline anchors that help teams connect system behavior to what changed. See "Every Change Leaves Evidence" later in this chapter for why this signal deserves its own discipline.
How the Pillars Work Together [Pillar Integration]
Investigations often begin with metrics that reveal a symptom, traces that locate it, logs that explain it, and events that show what changed. The order may vary, but the value comes from correlating the signals rather than examining each one in isolation.
Application Performance Management (APM) [APM]
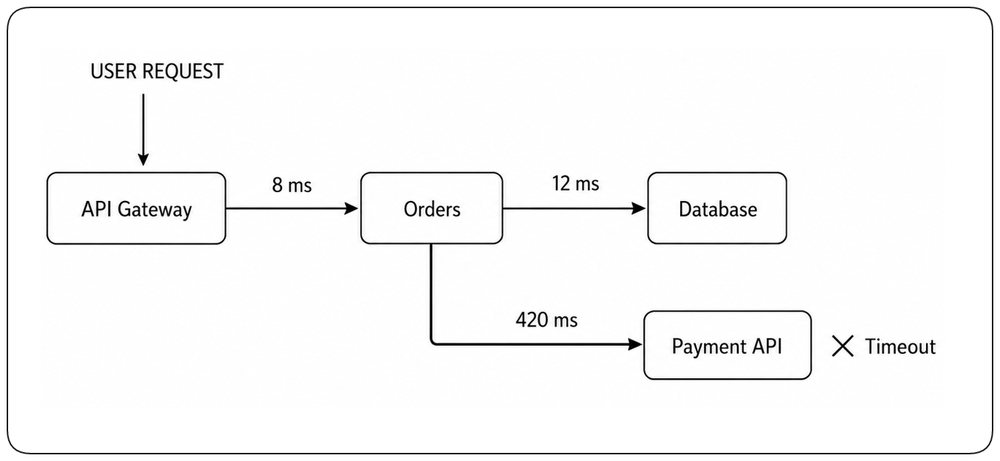
Application Performance Management connects user experience to system behavior. It shows how requests move through the system, where time is spent, and which component causes an error or slowdown. It turns a vague complaint such as “the app is slow” into a concrete technical cause.
Transaction Tracing: Following Requests End-to-End [Transaction Tracing]
Transaction tracing follows a request from the user action to the final response, recording every service, dependency, and processing step along the way. Timing data reveals where latency accumulates, whether in application code, a database query, an external API, or a queue. Instead of guessing why a system is slow, teams can identify the exact component responsible and act on concrete evidence.
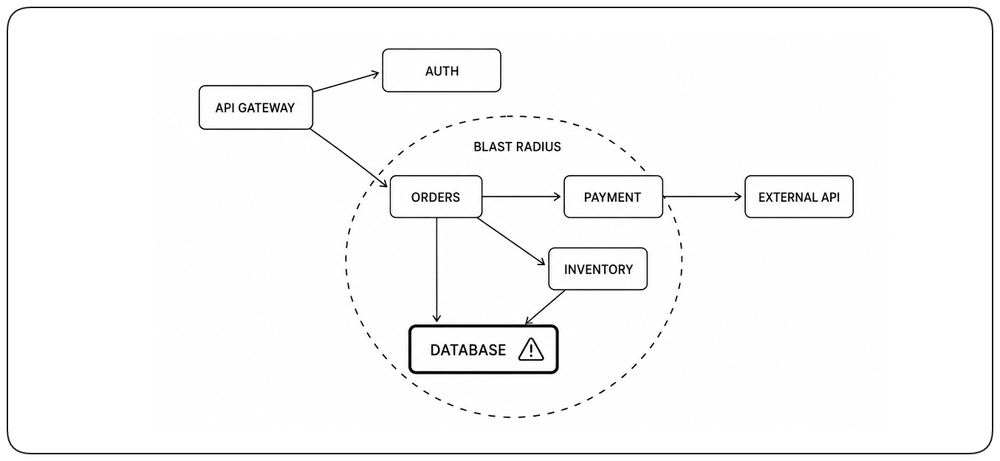
Service Maps and Dependency Visualization [Service Maps]
Service maps make system dependencies visible: which services call each other, where traffic flows, and how failures propagate. During an incident, they reveal the blast radius quickly, showing which components and user journeys depend on the failing service. This helps teams understand impact, identify likely propagation paths, and prioritize the response.
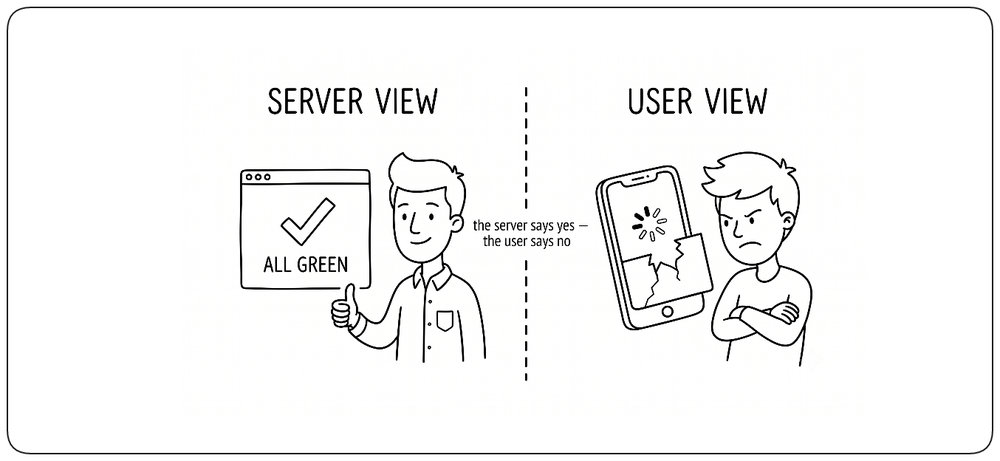
Real User Monitoring (RUM): Measuring from the User's Perspective [RUM]
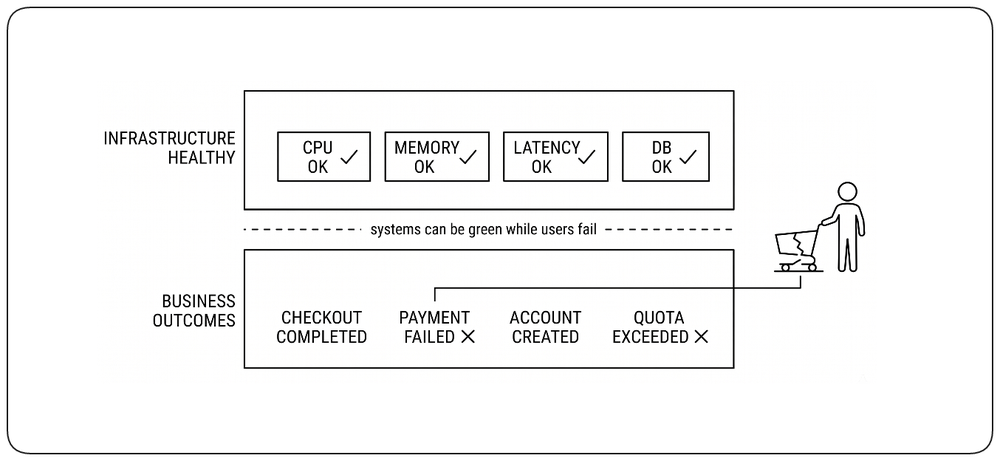
Server-side metrics can show green while users experience a broken application. Real User Monitoring captures performance from the user's actual browser or device: page load times, JavaScript errors, network latency, and interaction delays. RUM reveals problems that server metrics miss: slow client-side rendering, failed API calls from the browser, regional network issues, or device-specific problems. It answers the question that matters most: "What is the user actually experiencing right now?"
Synthetic Monitoring: Proactive Detection [Synthetic Monitoring]
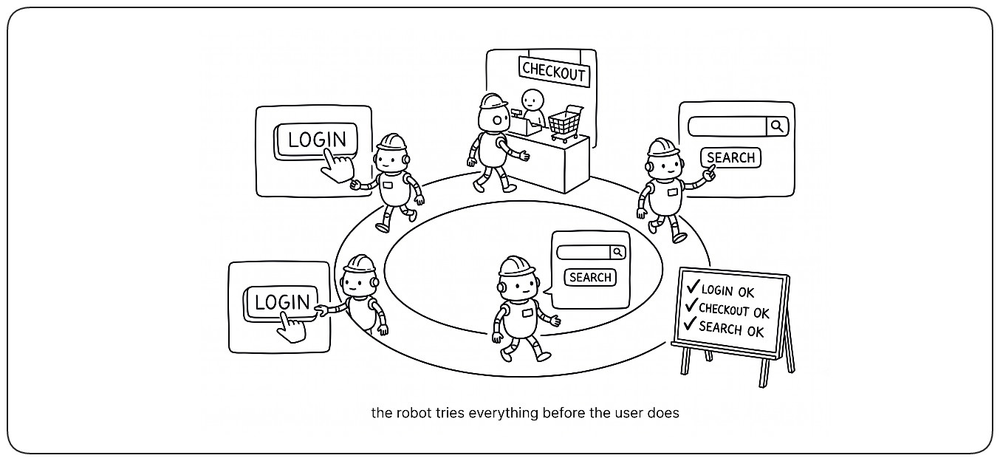
Synthetic monitoring runs automated tests against the system continuously—simulating user journeys, checking health endpoints, and verifying critical paths before users encounter problems. Unlike RUM, which reports what happened, synthetic monitoring detects issues proactively. Common synthetic checks include login flows, checkout processes, API health endpoints, and critical business transactions. When a synthetic check fails, teams know immediately that something is broken—often before any user reports it. This shifts incident response from reactive to proactive.
Translate Technical Performance into User Experience [User-Facing Metrics]
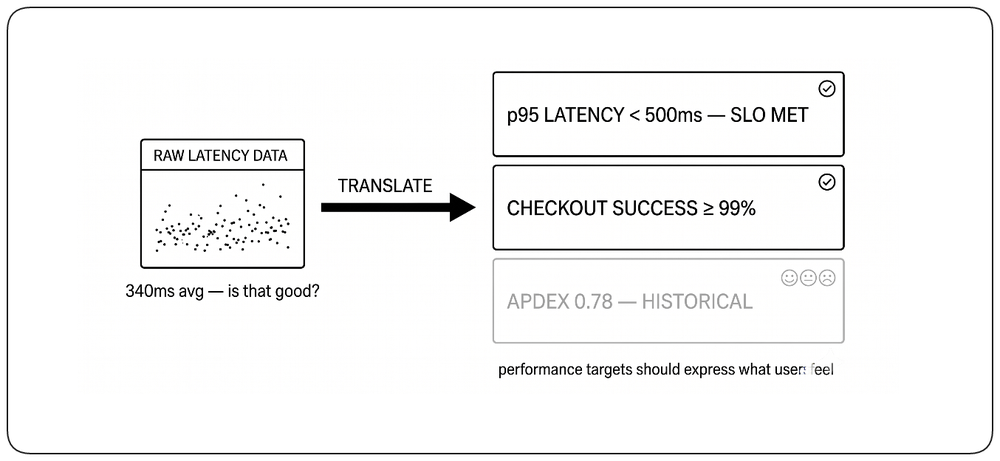
Raw latency numbers are hard to interpret—is 200ms good or bad? Effective APM translates technical measurements into indicators the whole organization can reason about. Modern teams rely on latency percentiles (p95, p99), SLIs and SLOs tied to user journeys, and error budgets. Apdex, historically, offered an early version of this idea by bucketing responses as Satisfied, Tolerating, or Frustrated. The specific formula matters less than the principle: performance targets should express what users feel, not just what the system does.
Observe Business, Not Just Systems [Business Signals]
Technical telemetry explains how the system behaves; business telemetry explains whether it delivers value. Checkout completed, payment failed, account created, quota exceeded—these events are first-class observability signals, not analytics data. Mapping the critical user journeys—login, search, checkout, payment—and tracking them as first-class entities is what turns technical metrics into business context: a 100ms slowdown on checkout matters more than the same slowdown on an admin dashboard, and "checkout success dropped 5% after the last deploy" is a sharper signal than "error rate increased." Healthy infrastructure is meaningless if these journeys fail silently.
Slice Before You Guess [Diagnostic Dimensions]
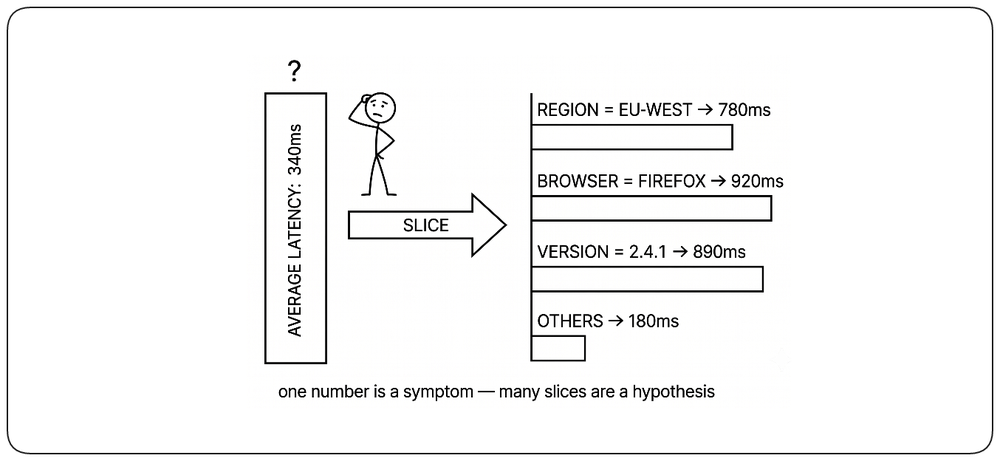
A single average hides more than it reveals. Modern APM answers questions like "checkout is slow" by slicing performance along dimensions: version, region, customer segment, browser, device, endpoint, feature flag, deployment. Every measurement should be filterable, so teams can move from "something is slow" to "checkout is slow for Firefox users in EU-West on version 2.4.1 since the last deploy" in seconds. High-cardinality dimensions are what turn a symptom into a hypothesis.
Platform Observability: Making Observability the Default [Platform Observability]
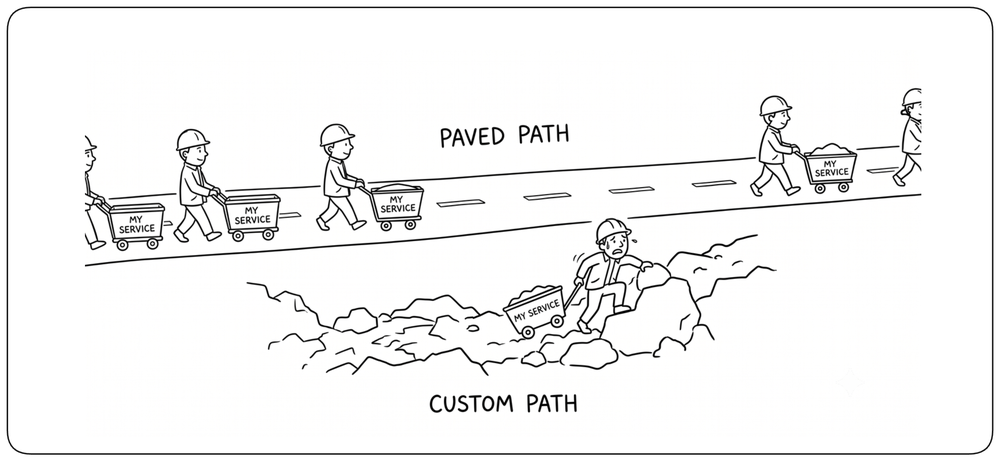
In mature organizations, observability cannot be a “team-by-team choice.” If every service invents its own dashboards, naming conventions, and instrumentation patterns, the result is fragmentation, slow incident response, and inconsistent reliability. Platform Observability means the platform makes services observable by default. Developers should get production-grade visibility from the first deployment, without needing deep expertise in telemetry tooling. Think of it as a paved road: teams can still build custom things, but the default path is safe, consistent, and fast.
Observability Is a Product, Not a Tool [Observability as Product]
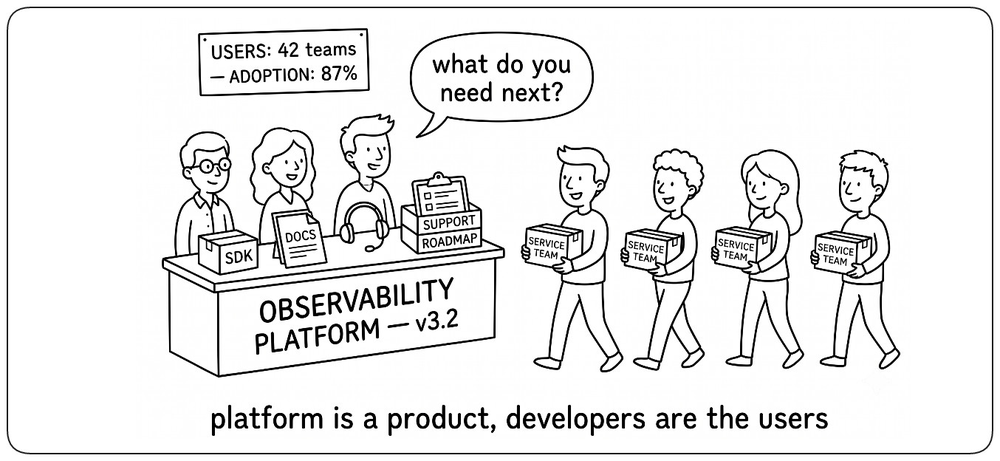
Mature organizations treat observability as an internal product, not a collection of tools. The platform team has real users—developers, SREs, on-call engineers—and owns SDKs, documentation, onboarding, support, conventions, and a roadmap. Adoption is measured. Feedback drives the next release. Like any successful product, observability must be easy to adopt, reliable, well documented, and continuously improved based on what its users actually need.
Separate Instrumentation from the Backend [Instrumentation vs Backend]
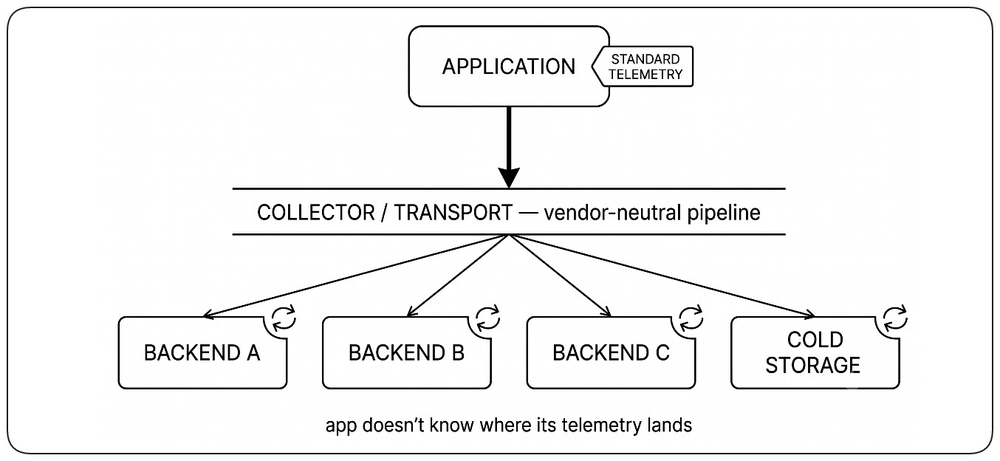
Applications should produce standard telemetry without depending on a specific observability vendor. Instrumentation belongs inside the application—what to emit, in what shape, with which identifiers. Storage, visualization, and analysis belong to the platform and should be interchangeable. This separation lets organizations change backends, add a second one, or route different signals to different destinations without touching a single line of application code.
Automatic Telemetry [Auto Telemetry]
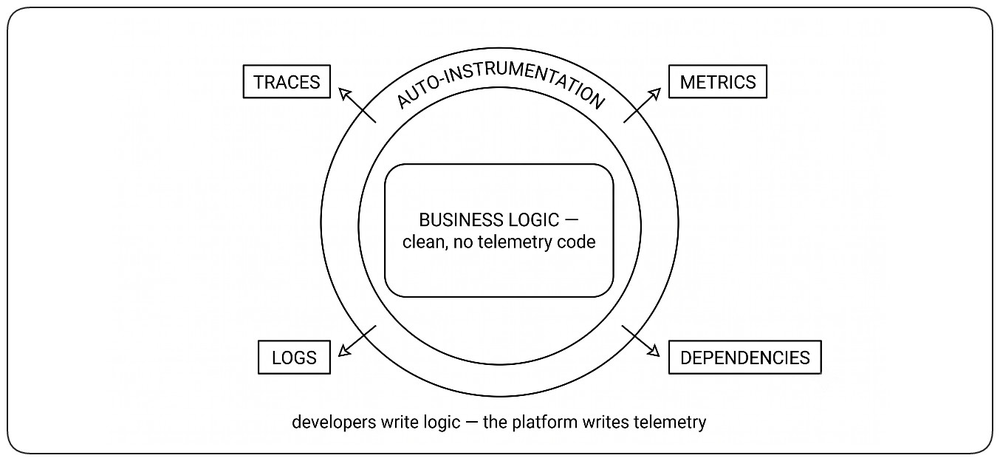
Developers should not have to remember to make their services observable. The platform should automatically capture the essential signals of every workload—metrics, traces, logs, and dependency calls—along with standard operational context: service name, version, environment, region, request IDs, and trace IDs. Teams focus on business logic while the platform captures the evidence needed to operate it.
Consistency Enables Understanding [Consistency]
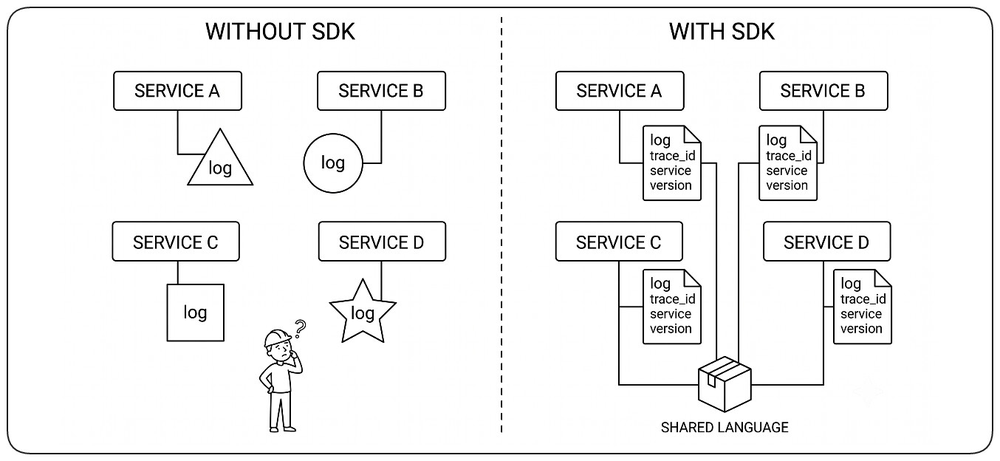
Observability only works when every service follows the same vocabulary. Shared SDKs, common schemas, consistent naming, trace propagation, and standardized identifiers let telemetry from independent services fit together naturally. Consistency is what transforms isolated signals into a coherent picture of the system, and what makes cross-service investigation possible.
One Investigation Plane [Investigation Plane]
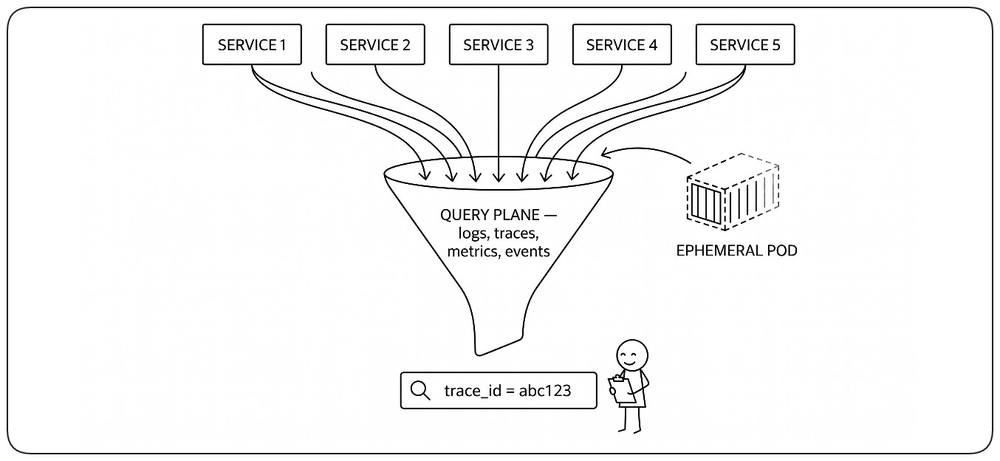
Engineers should investigate incidents, not hunt for data. Logs, metrics, traces, and events should arrive in a single queryable platform where they can be correlated immediately. Centralization survives ephemeral infrastructure, enforces retention and access rules, and turns investigation into a continuous workflow instead of a tool-hunting exercise.
Production Ready on Day One [Day-One Operability]
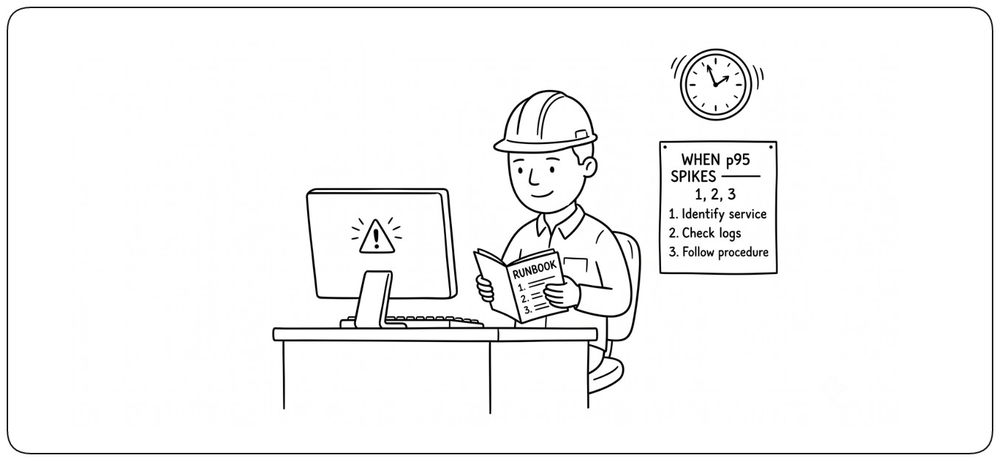
When the first production deployment completes, engineers should already have everything needed to operate the service: dashboards, alerts, deployment history, dependency health, and investigation entry points. Runbooks connect symptoms to actions, so engineers respond calmly under pressure. Teams should never begin production with an empty operational toolbox.
Every Change Leaves Evidence [Change as Evidence]
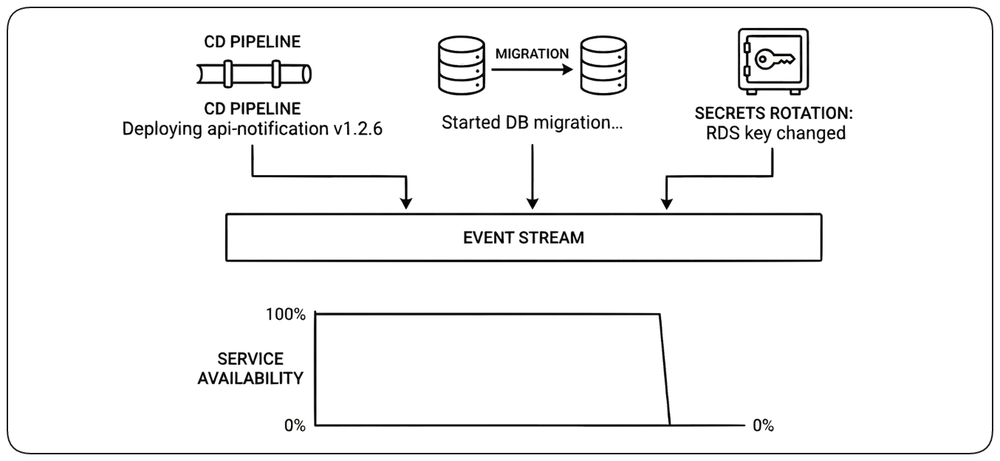
Most production incidents begin with a change—a deployment, configuration update, feature flag, secret rotation, scaling event, or dependency upgrade. These changes should be captured automatically as structured events and integrated into the observability platform. When engineers ask “what changed?”, the answer should come from evidence, not memory.
Learn More
Chapter: Design for Resiliency — see "When Do Failures Occur?"
Paved Path Developer Experience [Paved Path]
Teams should not have to decide how to build observability. The platform provides the libraries, templates, conventions, and tooling that make good observability the default. Doing the right thing should require no decisions, and teams remain free to customize when their needs go beyond the default.
Sampling Is a Design Decision [Sampling]
Collecting every signal is rarely practical, and sampling is not a cost-saving trick applied after the fact. It is a design decision that determines what will be investigable later. Sampling shapes which incidents can be reconstructed, which patterns will be visible, and which anomalies will remain hidden. Good sampling preserves the evidence needed to explain failures—complete traces on errors, richer capture on slow paths—while thinning routine traffic that adds volume without insight.
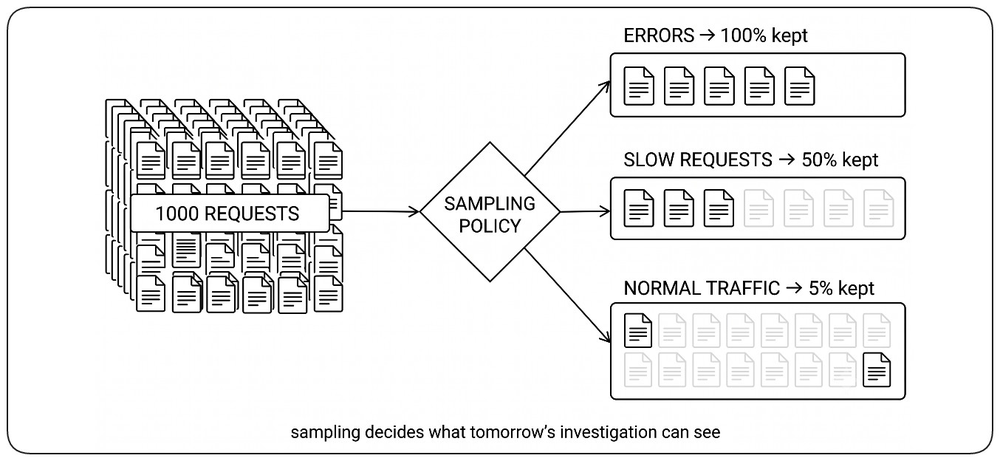
Not All Telemetry Has the Same Value [Value Tiering]
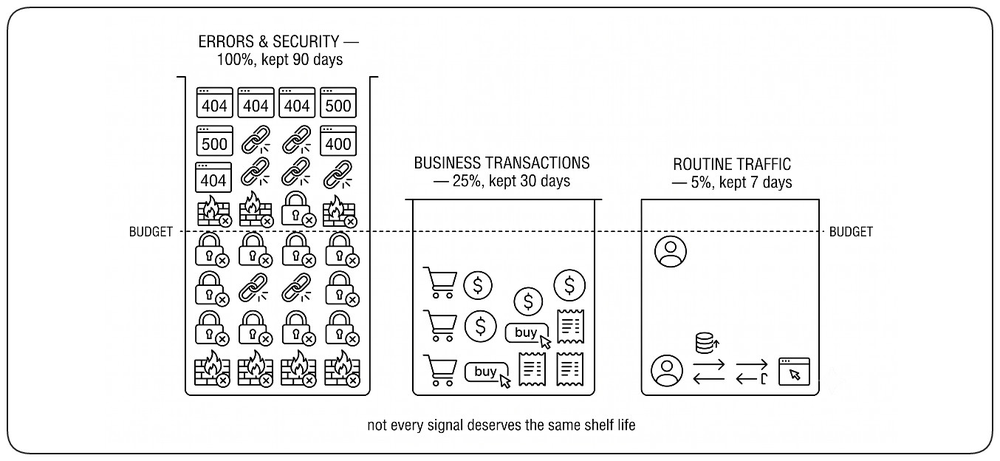
Different telemetry deserves different treatment. Errors, security events, and customer-impacting transactions often justify complete collection and long retention. Routine successful traffic can be aggressively sampled. Debug-level detail may be retained only for a few days. Treating all signals identically wastes budget on low-value data and starves the categories where evidence matters most. Value tiering makes the trade-off explicit: what is precious, what is expendable, and for how long.
Observability Has Economics [Economics]
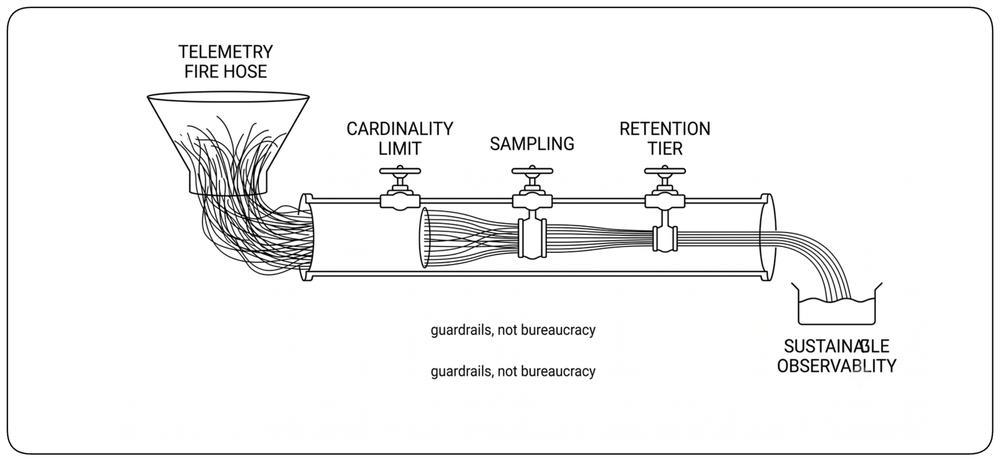
Observability is not free. Every metric label, trace, log, and retention decision has a cost that grows with scale. Sustainable platforms control telemetry through three levers: cardinality, sampling, and retention. Good governance provides the defaults that keep visibility affordable without sacrificing investigative value.
Observability Must Not Leak Sensitive Data [Privacy by Design]
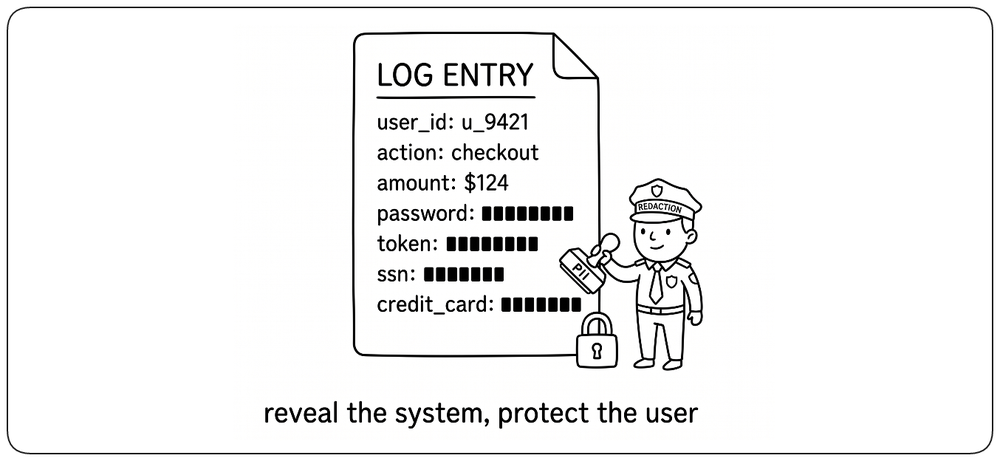
Observability increases visibility—which is exactly what makes it dangerous when handled carelessly. Secrets, credentials, personal data, tokens, and regulated information must never appear in logs or traces unless explicitly protected. Rich context and data minimization are not opposites: effective platforms redact at the source, classify fields by sensitivity, enforce access controls on stored telemetry, and treat every log line as potentially auditable. The platform that reveals the most about the system should reveal the least about its users.
Observability Becomes an Organization Property [Org Property]
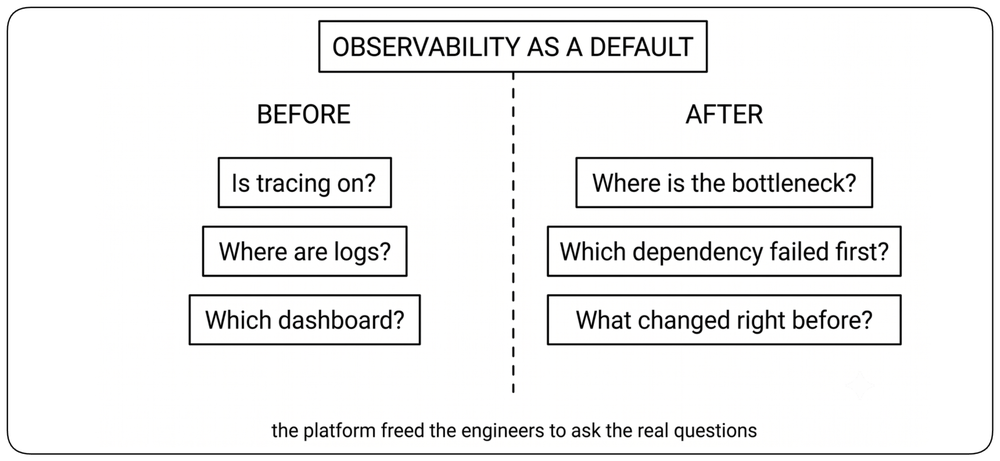
When the platform owns observability, teams stop asking whether telemetry exists or where to find it. They immediately investigate user impact, identify bottlenecks, correlate changes, and resolve incidents from evidence rather than intuition. Observability is no longer something individual teams build—it becomes infrastructure that every team inherits.
Making Errors Visible [Making Errors Visible]
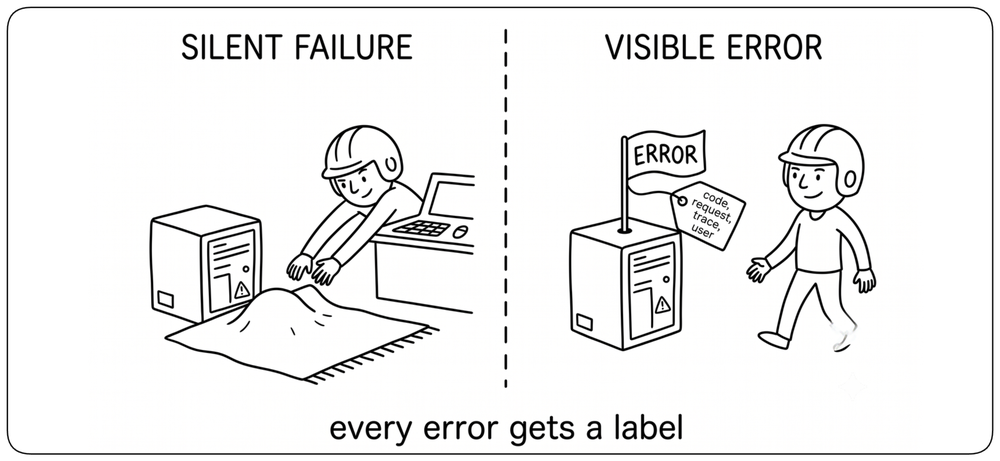
Errors are inevitable; invisible errors are unacceptable. Effective error handling in observable systems goes beyond catching and logging—it ensures that every failure becomes a visible, contextual, and actionable signal. Without proper error handling design, teams waste time chasing symptoms instead of causes.
Every Error Is Evidence [Errors as Evidence]
An error is not just a signal that something failed—it is a piece of evidence that should explain what happened, where, and why. Errors that are swallowed, masked, or logged without context become blind spots. A system designed for observability surfaces errors explicitly: they propagate with enough context to be correlated with the request, user, and deployment, and to guide the next action. Every error path should preserve enough structured context to become usable evidence.
Structured Error Context [Error Context]
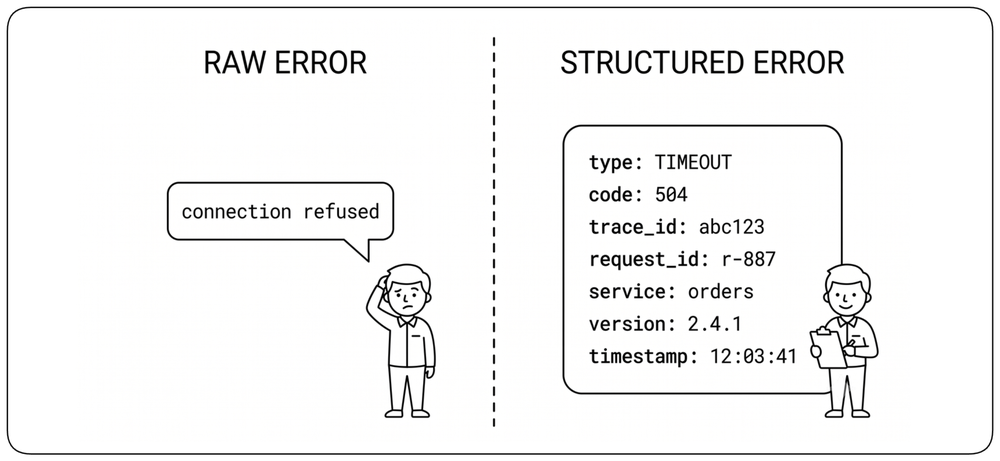
Raw messages such as “connection refused” or “timeout” are not enough for diagnosis. Errors should include the failed operation, dependency, retry state, correlation identifiers, timestamp, and relevant service metadata. This structure turns a generic failure into evidence that can be searched, grouped, and correlated across logs, traces, and metrics.
Standard Error Contracts [Error Contracts]
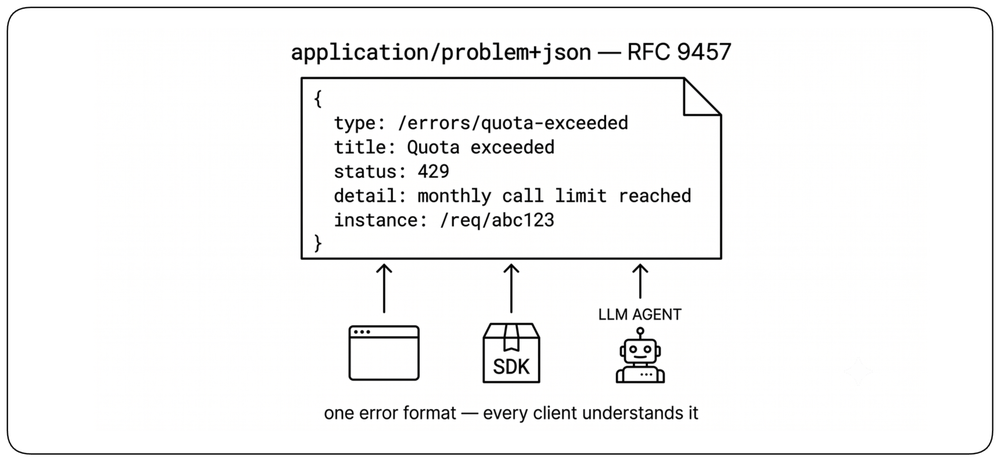
Errors are part of the API surface, and their shape is part of the contract. When every service invents its own error format, clients and observability tools spend more time parsing than reacting. A standard error contract—stable fields, machine-readable type, human-readable message, trace identifier—turns errors into first-class citizens that SDKs, dashboards, and AI agents can interpret without custom code.
RFC 9457 — a ready-made contract
RFC 9457 defines application/problem+json with a shared set of fields (type, title, status, detail, instance) and room for domain extensions. Adopting it—or a similar internal standard—removes an entire class of parsing bugs and makes errors interoperable across teams, tools, and languages.
Return a Trace ID with Every Error [Trace ID Support]
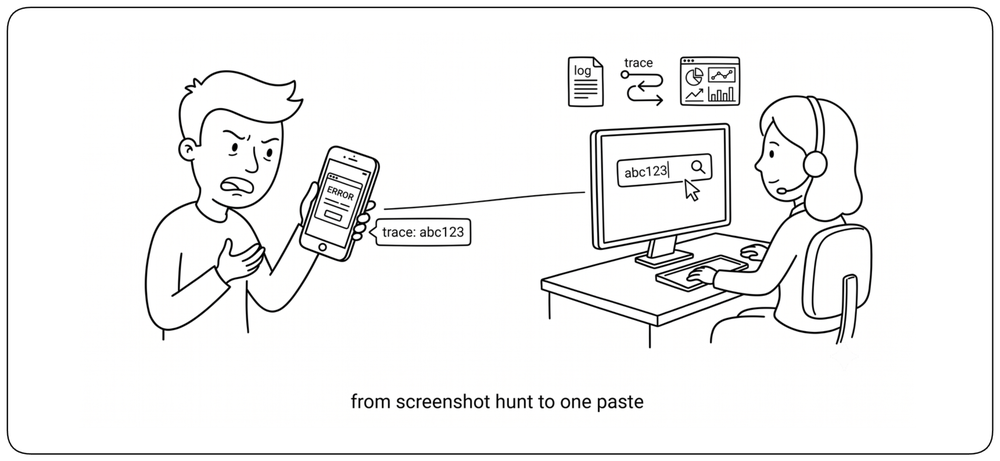
Every error response should return a trace identifier in the body or headers. This identifier links the user-facing failure to the internal logs, traces, and metrics collected by the observability platform. Instead of asking for screenshots, timestamps, and user details, support can search the trace ID and immediately see what failed, where, and why. A trace ID turns a reported incident from a manual investigation into a direct lookup.
Group Errors by Cause, Not Message [Error Grouping]
Error tracking should group failures by their likely cause, not only by identical message text. The same defect may produce different messages, while identical messages may come from unrelated causes. Effective grouping combines error type, stack location, service, operation, and surrounding context to turn thousands of occurrences into a small number of actionable problems.
Error Classification for Actionability [Error Classification]
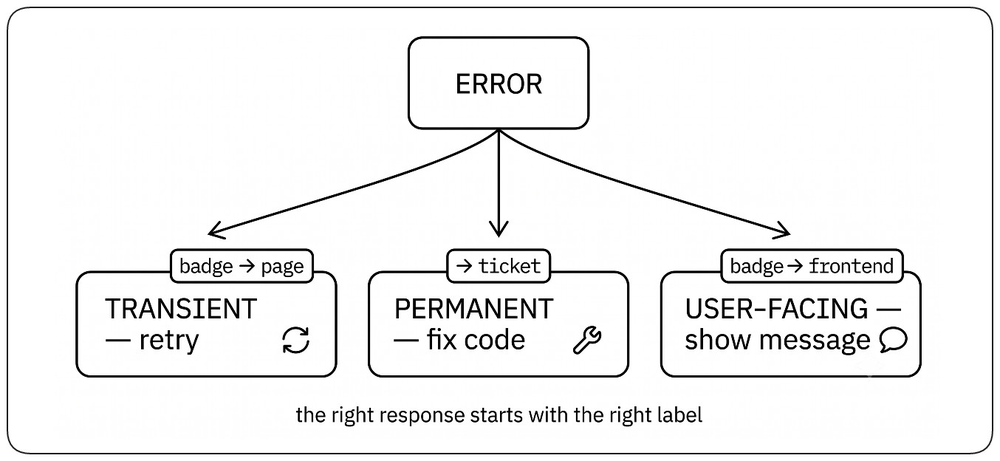
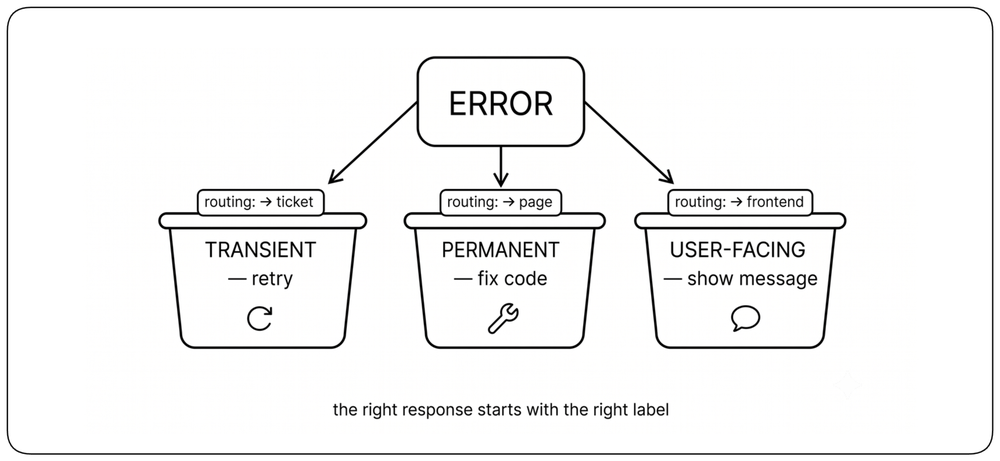
Error classification determines the appropriate response. Useful dimensions include whether a failure is transient or permanent, retriable or fatal, and user-facing or internal. Consistent classification helps systems, operators, and automated callers decide what should happen next.
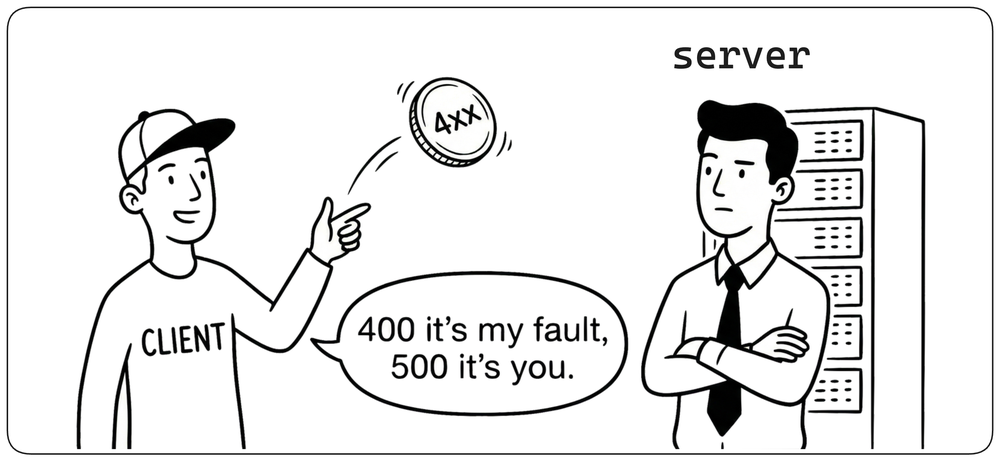
4xx vs 5xx: Distinguishing Client Responsibility from Infrastructure Failure [4xx vs 5xx]
HTTP status classes must reflect who is responsible for the failure. 4xx means the request is invalid or cannot be fulfilled as submitted: the client must change something. 5xx means a valid request failed because of the server or its dependencies: the service team must act. Misclassification corrupts observability. Counting 4xx responses as availability failures creates false alerts, while returning 4xx for server failures hides real incidents. The rule is simple: 4xx means fix the request; 5xx means fix the service.
Error Classification Enables Resilience Mechanisms [Classification Resilience]
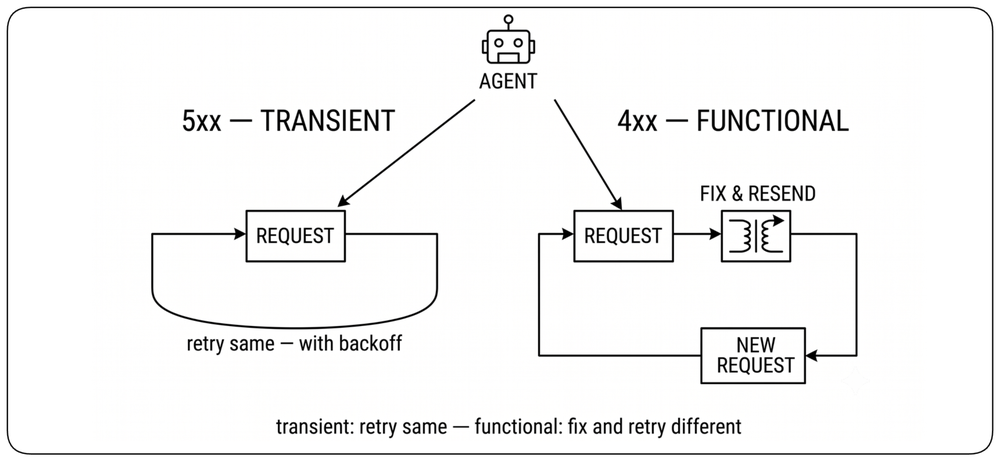
Error classification determines the correct resilience response. Transient failures such as timeouts or 5xx errors may justify retrying the same request, often with backoff. Functional failures such as malformed input or validation errors require changing the request before trying again. This distinction is especially important for automated callers and LLM agents: transient means retry; functional means fix and retry differently. Classification is what makes the right resilience mechanism possible.
Learn More
Chapter: Design for Resiliency — see Retry Pattern and The Limits of Retry.
Error Propagation and Trace Continuity [Error Propagation]
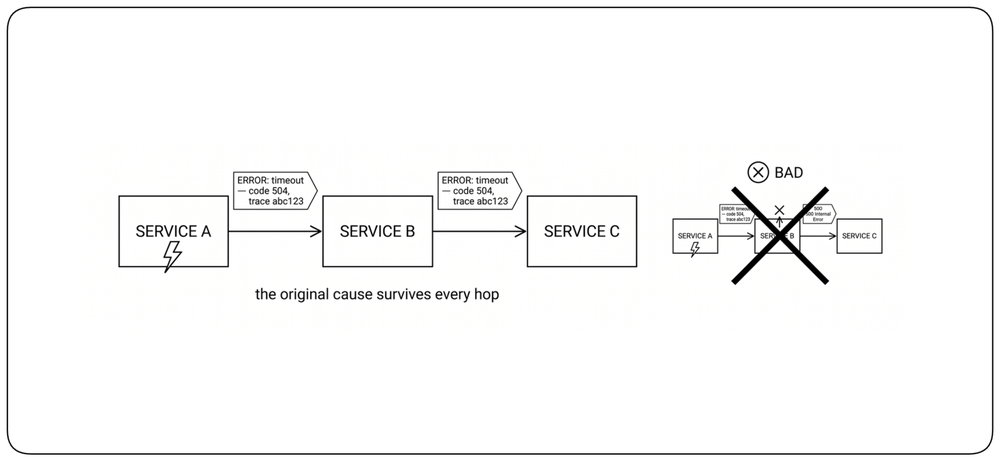
In distributed systems, errors often originate in one service and surface in another. When an upstream service fails, the downstream service should propagate the error—or a summarized version—while preserving trace continuity. Losing the original error context at service boundaries makes root cause analysis impossible. Best practice: propagate error codes and identifiers, attach them to spans and logs, and avoid overwriting or discarding upstream error context. The goal is a coherent error story across the entire request path.
Alerting
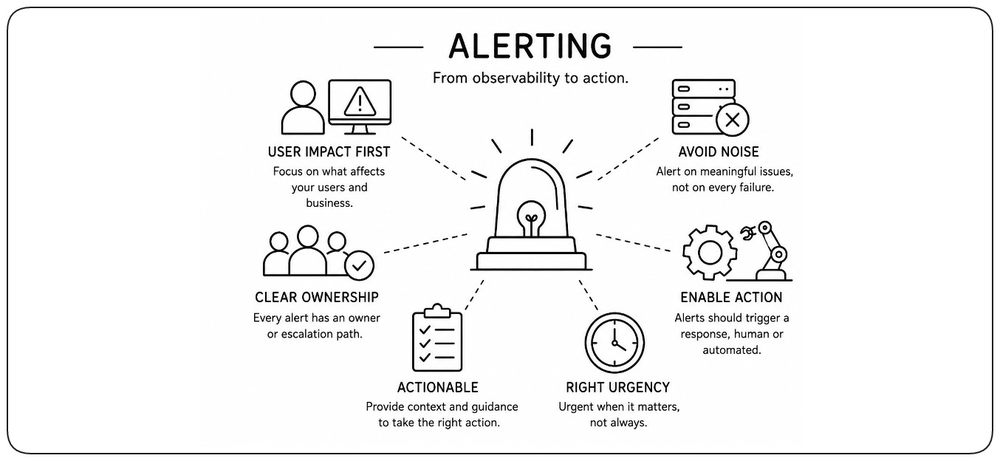
Alerting transforms observability into action. While observability helps teams understand what is happening and why, alerting determines when intervention is required. Its purpose is not to notify every anomaly, but to detect situations that require a specific response from either a human or an automated system. Effective alerting prioritizes user impact over individual failures, minimizes unnecessary interruptions, and ensures that every alert has a clear owner and an expected action.
Decoupling Applications from Alerting Logic [Alert Decoupling]
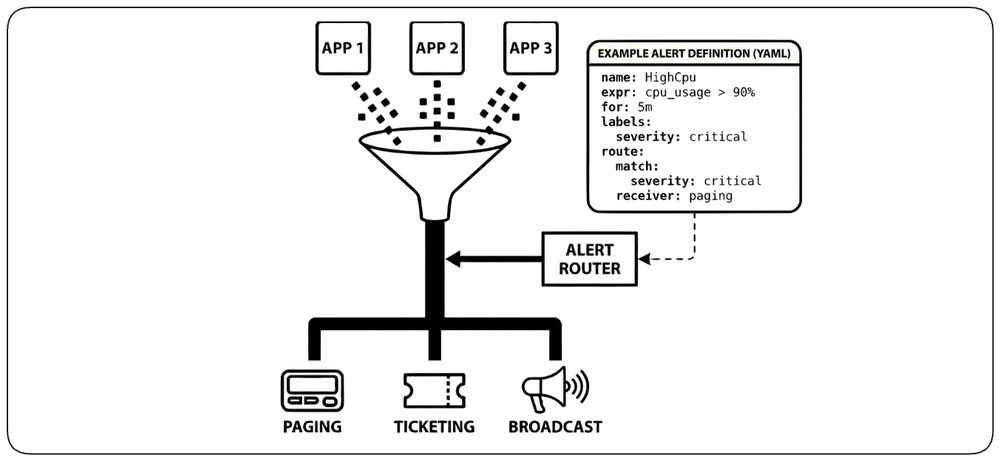
When alerting logic is embedded in application code, it becomes hard to maintain and inconsistent across services. Updating thresholds or routing often requires code changes and deployments, which couples operational decisions to product release cycles. A centralized alert router keeps this logic separate. Services emit signals, and alert rules evolve independently: paging stays rare, ticketing stays actionable, and routing can change without touching application code.
Alerts as Code: Versioning and Review [Alerts as Code]
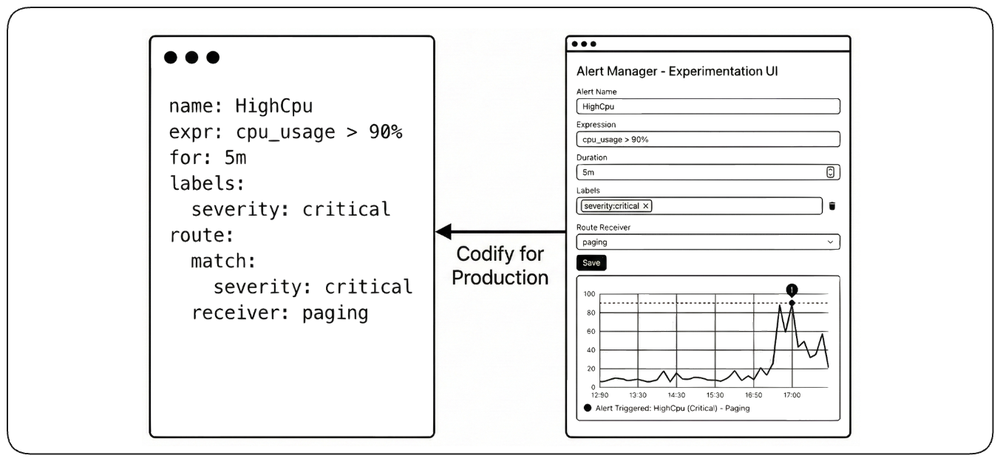
Alert definitions should be managed as code, following Infrastructure as Code principles. UI interfaces are useful for experimentation and quick testing, but production alerts should be defined in version-controlled configuration files, go through code review, and be deployed via CI/CD pipelines. This ensures changes are traceable, reviewable, and consistent across environments. The workflow should support experimentation via UI, then codification for production use.
Detect Configuration Drift [Config Drift]
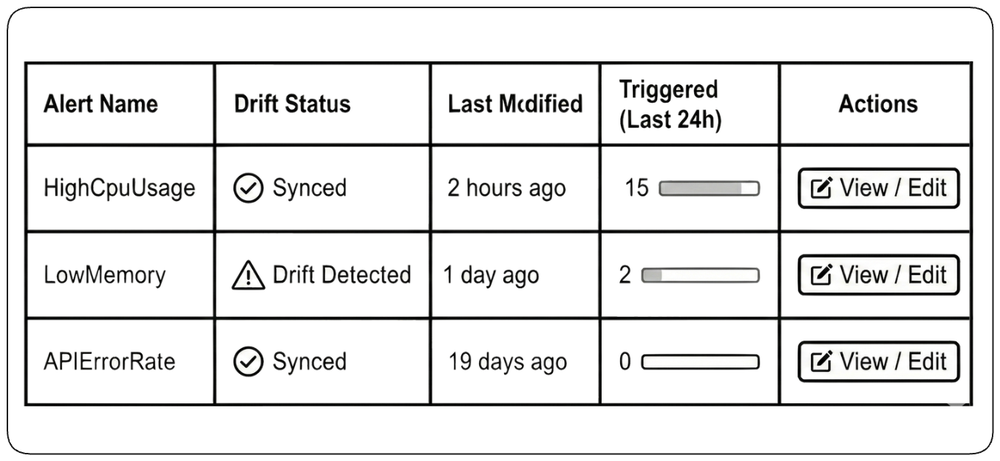
In any dual-mode system that supports both code and UI configuration, it is critical to detect and indicate configuration drift—when the UI configuration diverges from the code definition—to prevent inconsistencies and ensure teams know which source of truth is authoritative.
An Incident Is About User Impact, Not Individual Failures [User Impact] {1}
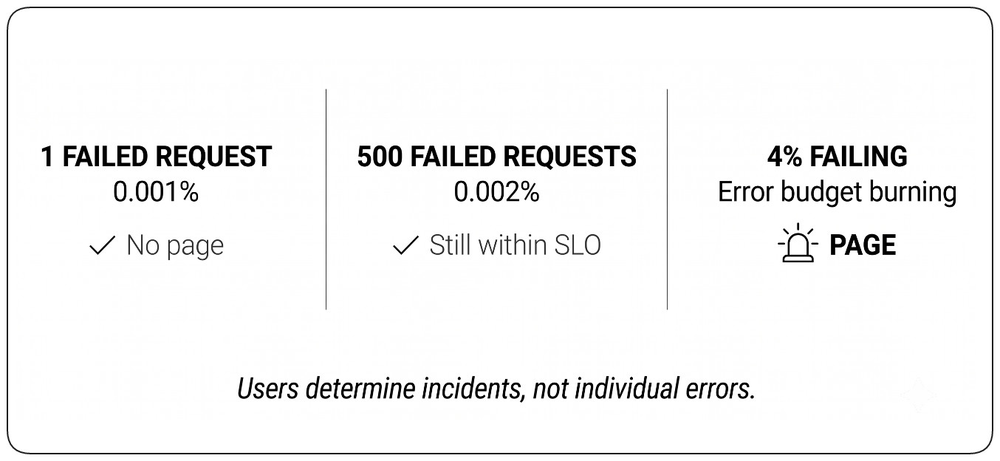
Failures are inevitable. A few failed requests do not necessarily indicate an incident, and waking an engineer for every isolated error would quickly create alert fatigue. !!What matters is sustained user impact.!! An incident begins when failures exceed the level the service has agreed to tolerate, typically defined through SLIs, SLOs, and the error budget. Alerting should protect that user experience, not react to every individual failure.
Measure What Users Experience [Aggregate SLO] {1}
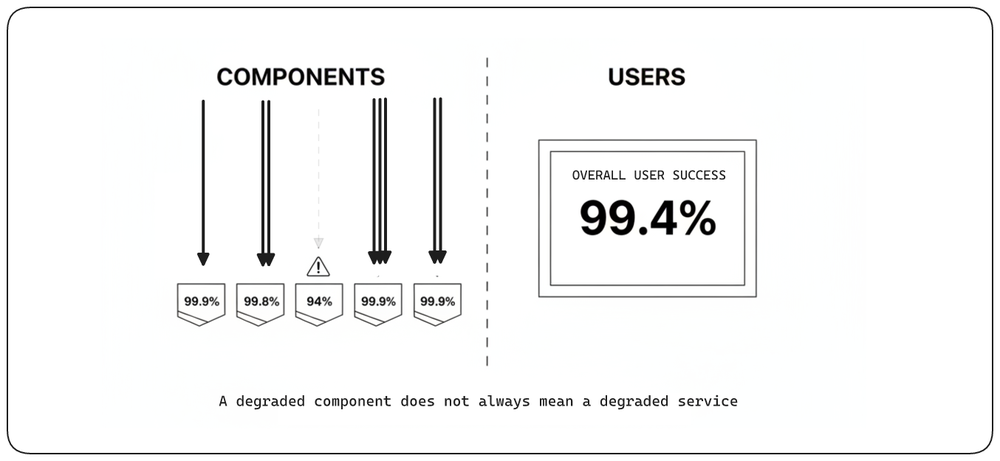
A single server or shard may look unhealthy while users are barely affected. The opposite can also happen: every component looks healthy, but some users still fail. !!The SLO should measure the result users receive across the whole service.!! Internal metrics help find the problem, but they should not define the promise.
Learn More
Google SRE Workbook, Alerting on SLOs: "Define your SLO in terms of what matters to the aggregate user experience, not per-shard or per-component metrics."
Count Requests, Not Minutes [Request-Based SLOs] {1}
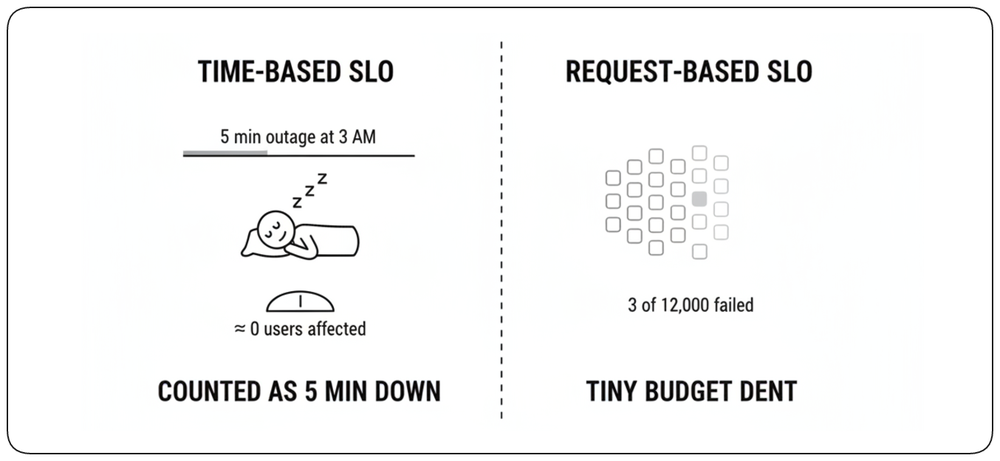
A time-based SLO counts how long the service was unavailable. But five minutes at night may affect almost nobody, while five minutes during peak traffic may affect thousands of users. !!A request-based SLO counts what really matters: how many user requests succeeded or failed.!! This gives a more accurate picture of user impact.
Learn More
Google SRE Workbook, Alerting on SLOs: "We generally recommend using request-based SLOs whenever possible, because they better reflect actual user experience."
Burn Rate: Two Speeds, Two Responses [Burn Rate] {1}
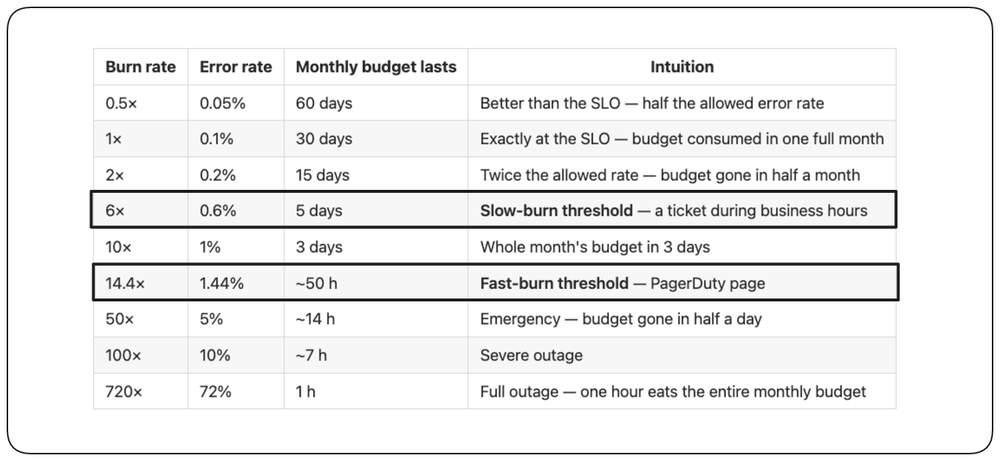
Alerts based only on a fixed error threshold can be misleading. A small error rate may be harmless for a few minutes but serious if it lasts for hours. !!Burn rate shows how quickly the error budget is being consumed.!! Google SRE recommends two alerts: a fast-burn alert that pages the on-call engineer, and a slow-burn alert that creates a ticket for working hours.
Learn More
Google SRE Workbook, Alerting on SLOs: "For the fastest burn rate — for example, a burn rate that would consume the entire error budget in a small number of hours — you should page a human immediately. For slower burn rates that would still exhaust the budget in a few days, a ticket that's addressed during working hours is more appropriate."
Don't Page for an Incident That Already Ended [Multi-Window] {1}
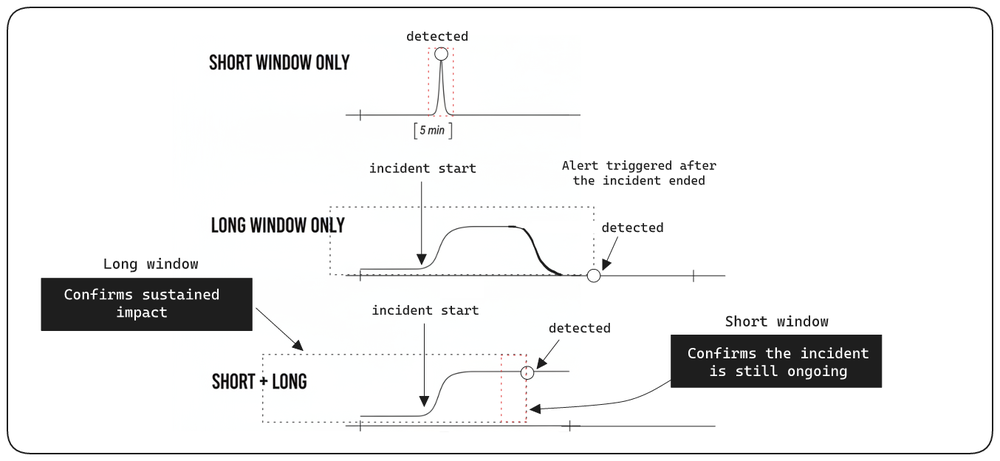
A long burn-rate window confirms that an incident was serious, but it may trigger only after the problem has already disappeared. A short window alone reacts immediately, but it may page on a brief spike. !!Google SRE combines both with a logical AND: the long window confirms the incident lasted long enough to matter, while the short window confirms it is still happening.!! The alert fires only when both conditions are true.
The Three Types of Alerts [Alert Types]
There are only three types of alerts, each corresponding to a different response mechanism and urgency level. Understanding these categories helps teams design effective alerting strategies that match response actions to alert severity. Every alert should fit into one of these three categories—if it doesn't, it's not an alert, it's an observability signal that belongs on a dashboard or in logs.
Immediate Action Required: Page [Page Alerts]
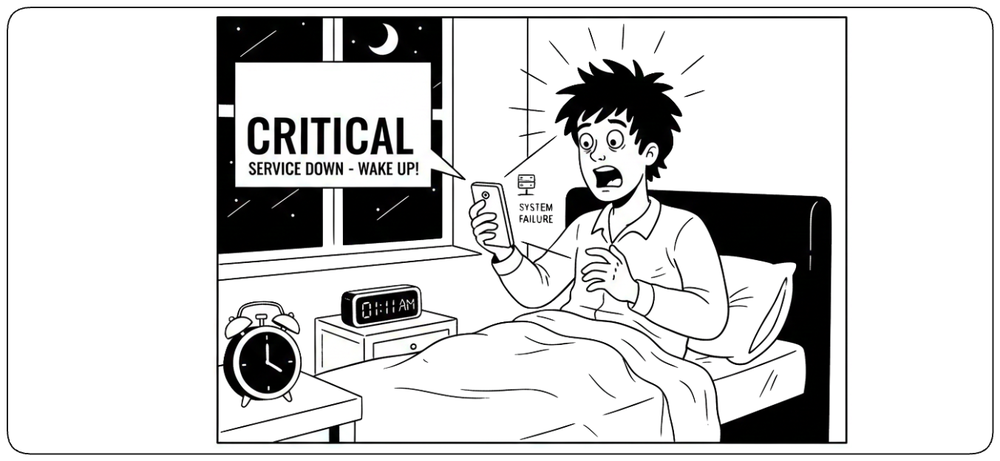
Page alerts are reserved for situations that require an immediate human response to protect users, revenue, or data. They should be rare, high-signal, and clearly tied to real impact (service down, critical errors, security risk). If it’s not urgent enough to wake someone up, it should not be a page.
Action Required Soon: Ticket [Ticket Alerts]
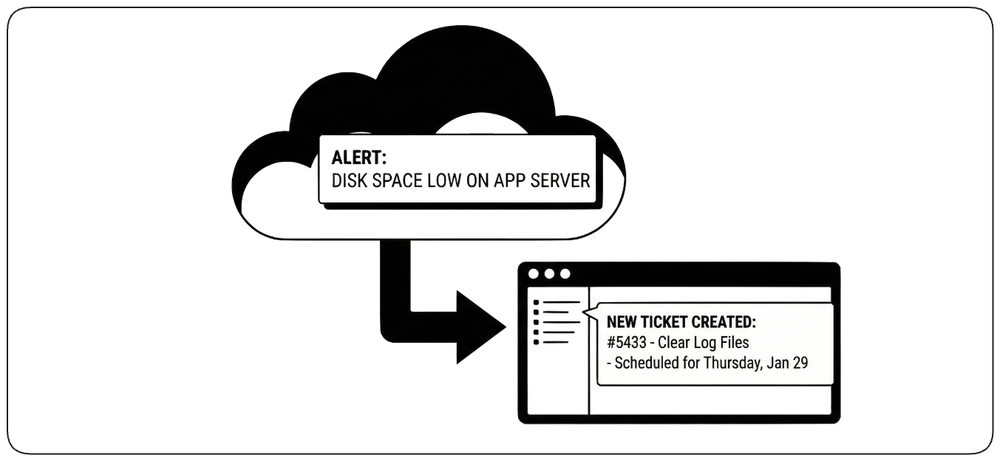
Ticket alerts are issues that must be fixed or investigated soon, but do not justify interrupting on-call immediately. They are typically early warnings (increasing error rate, degraded performance) that require action to prevent predictable problems from becoming incidents. The objective is controlled, planned work—not emergency response. A ticket must also carry a maximum age: if it stays open past its handling deadline, it should escalate automatically to a page. Without that safety net, tickets quietly pile up until the leak they were tracking becomes the incident nobody caught.
Automatic Remediation: Script [Automated Alerts]
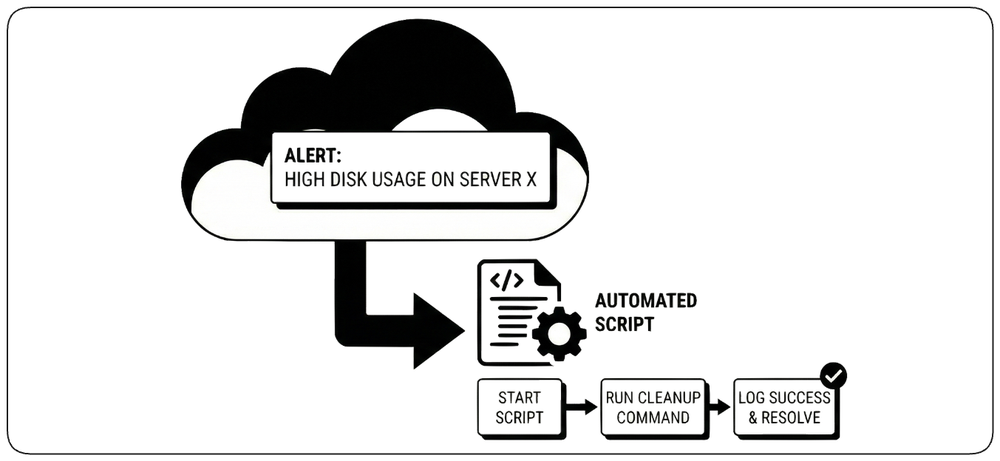
Automated remediation alerts trigger a predefined and safe action without human intervention. They work best for repetitive, well-understood problems with low-risk fixes (cleanup, restart, resync, scale). These alerts should still be observable, so teams can verify that the automation is working and not masking deeper failures.
Every Alert Must Have an Owner [Alert Ownership]
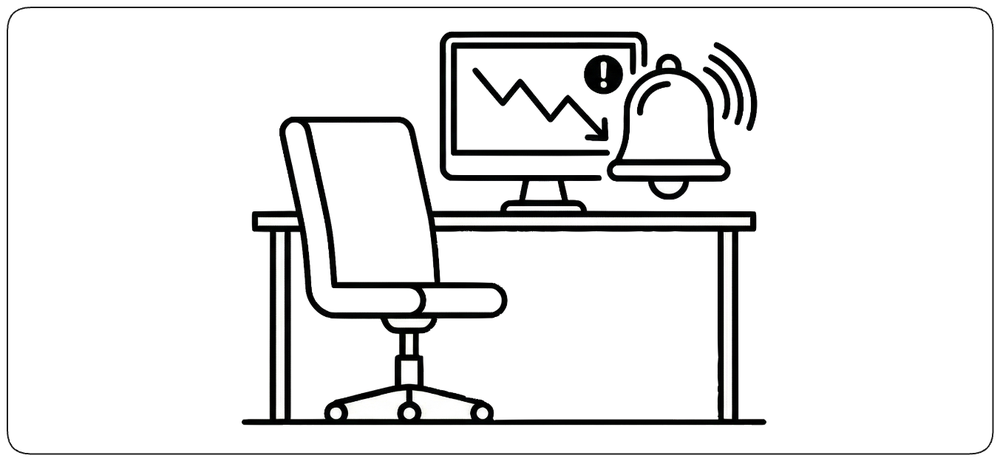
An alert creates value only when someone is responsible for acting on it. Without a clear owner and expected response, alerts become noise and incidents remain unresolved. Every alert should map to a team or on-call rotation, a defined action, and explicit accountability.
Learn More
Chapter: Design to Be Operated — see "Paging and On-Call".
Detecting the Signal in the Noise: Time-Series Based Alert Systems [Time-Series Alerts]
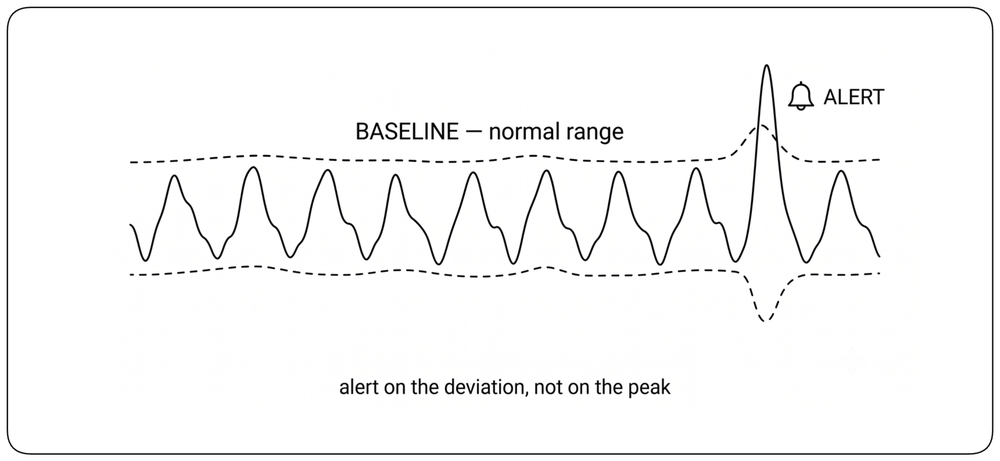
Alerts should be based on signals over time, not on isolated datapoints. The goal is to detect meaningful deviations from normal behavior while avoiding noise from expected variability (traffic patterns, daily peaks, seasonal effects). Good alerting uses baselines and trends to reduce false positives and produce alerts that lead to action.
False Positives: The Challenge of Alert Accuracy [Alert Accuracy]
False Positives occur when monitoring systems trigger alerts for minor anomalies rather than actual incidents. This constant noise creates alert fatigue, causing teams to mistrust their tools and become desensitized to notifications. As a result, engineers may ignore critical warnings or respond too slowly when a real crisis hits. To prevent this, alerts must be rigorously tuned to be actionable and focused on genuine user impact rather than raw metric spikes.
Alerts on Everything, Action on Nothing [Alert Overload]
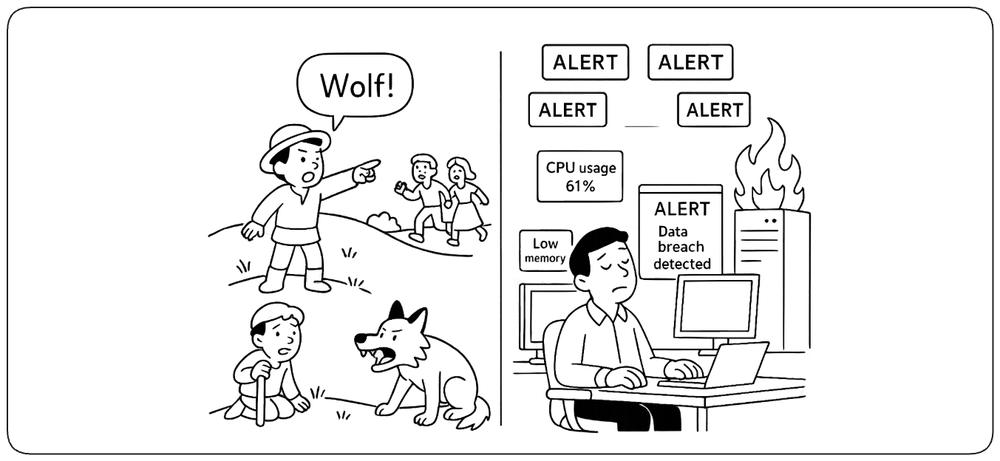
Alerting on every metric creates fatigue and weakens trust. When everything is urgent, nothing is. Teams begin ignoring notifications, disabling rules, or adding filters that hide real incidents. Effective alerting requires discipline: page only when human action is needed, prioritize by impact, and prefer a small set of trusted alerts over a large volume of noise.
Informational Alerts are Anti-Pattern [No Informational Alerts]
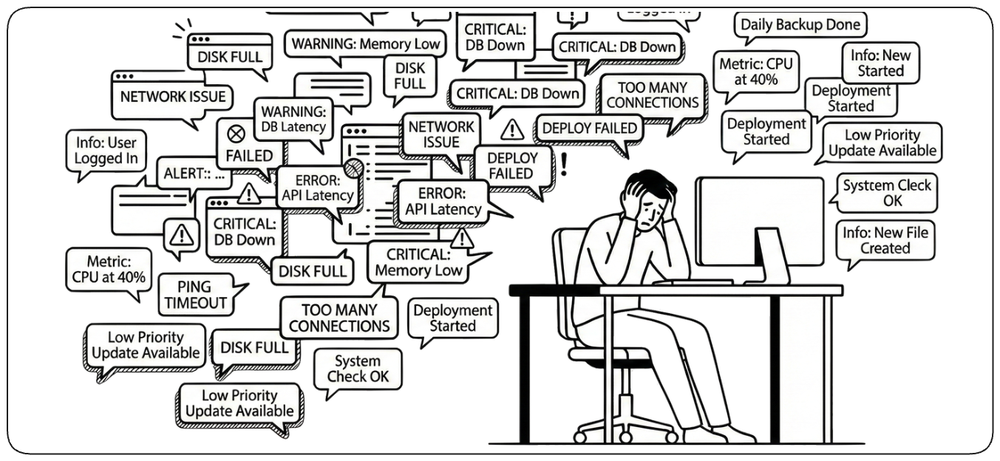
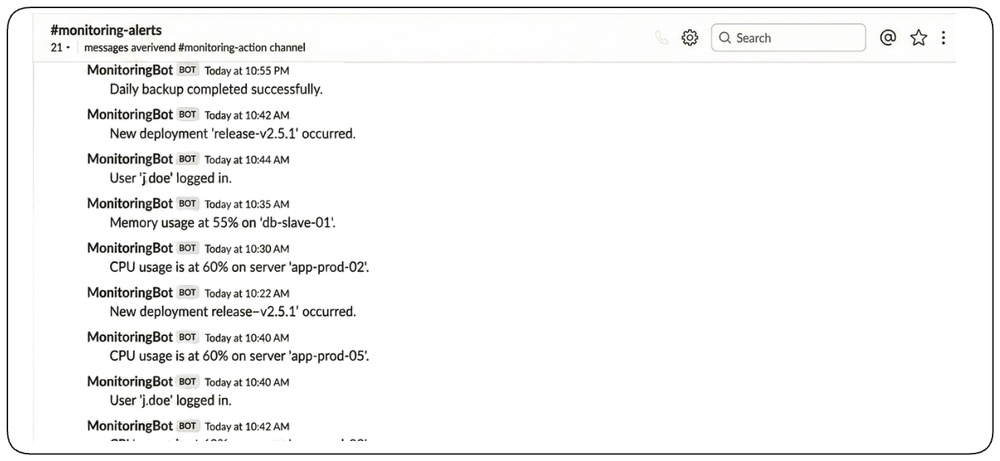
An alert is an interruption that demands action. If no one needs to act, it is not an alert—it is a metric, log, or event. Informational alerts add noise, create fatigue, and weaken trust in monitoring. Before creating one, ask: What should the on-call engineer do when this fires? If the answer is “nothing” or “just be aware,” it belongs on a dashboard or in a log, not in the alert channel.
Human Factors and Process
Observability is Also About Humans and Process [Human Factors]
Observability is not only technical. Perfect metrics, logs, and traces deliver no value if teams cannot interpret them, trust them, or act on them. Noisy alerts create fatigue, inconsistent signals slow investigations, and uncaptured lessons lead to repeated failures. Effective observability reduces cognitive load through clear entry points, reliable signals, runbooks, training, and shared operational practices.
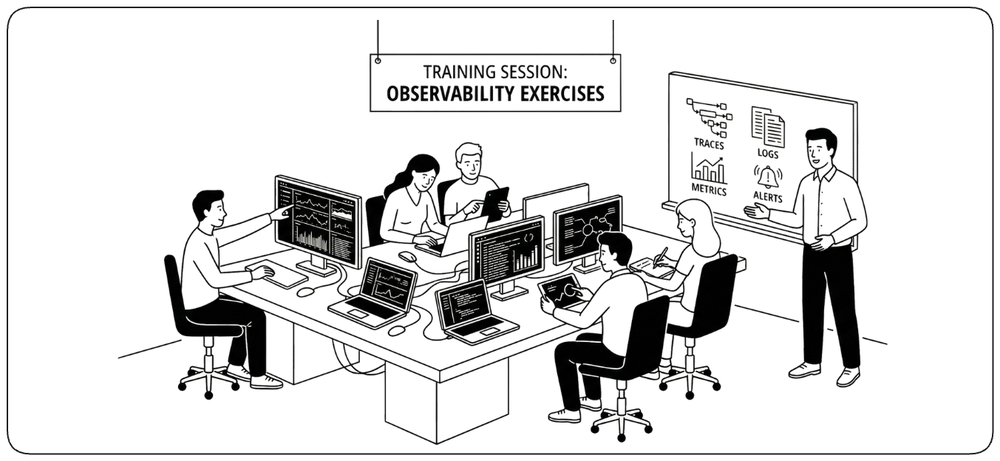
The Unglamorous Work Nobody Celebrates [Invisible Work]
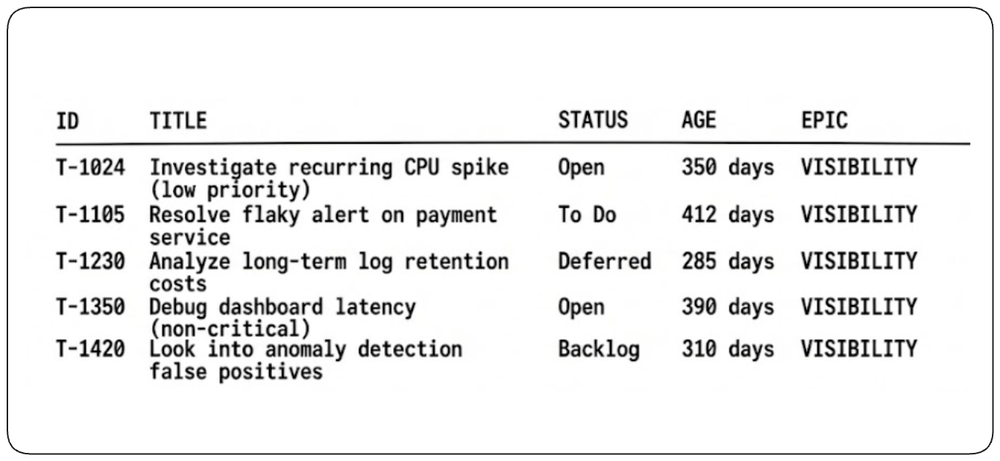
Observability work is essential but rarely visible. Better dashboards, cleaner alerts, and richer logs prevent incidents from escalating, yet receive less recognition than feature work. As a result, gaps discovered during incidents are often deferred and recur. Leaders must correct this incentive imbalance by prioritizing observability improvements, assigning ownership, and treating them as essential maintenance rather than optional polish.
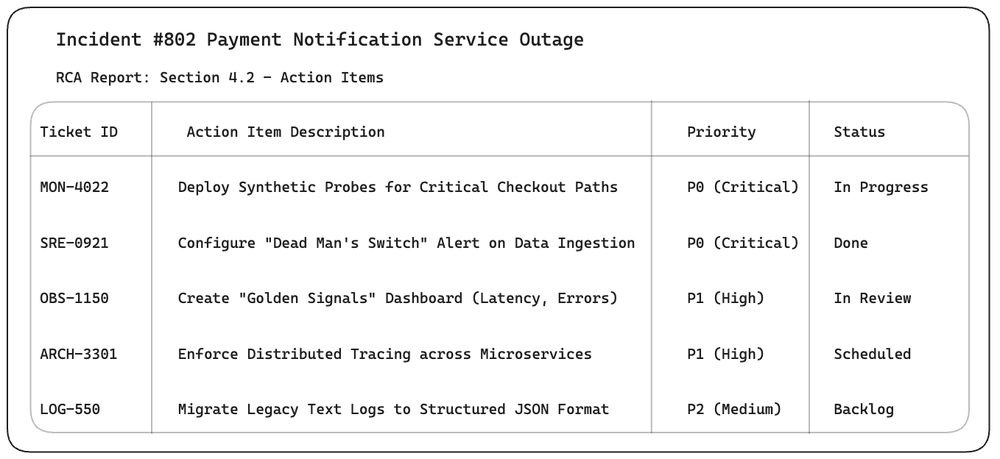
Using Post-Mortems to Drive Observability Investment [Post-Mortem Momentum]
Post-mortems should improve more than the product—they should improve observability. During normal operations, teams naturally prioritize features over dashboards, alerts, and instrumentation. Incidents change those priorities. Post-mortems are the moment to identify the missing visibility that slowed detection or diagnosis and turn those gaps into tracked engineering work with clear ownership. Every incident should leave the system not just fixed, but more observable than before.
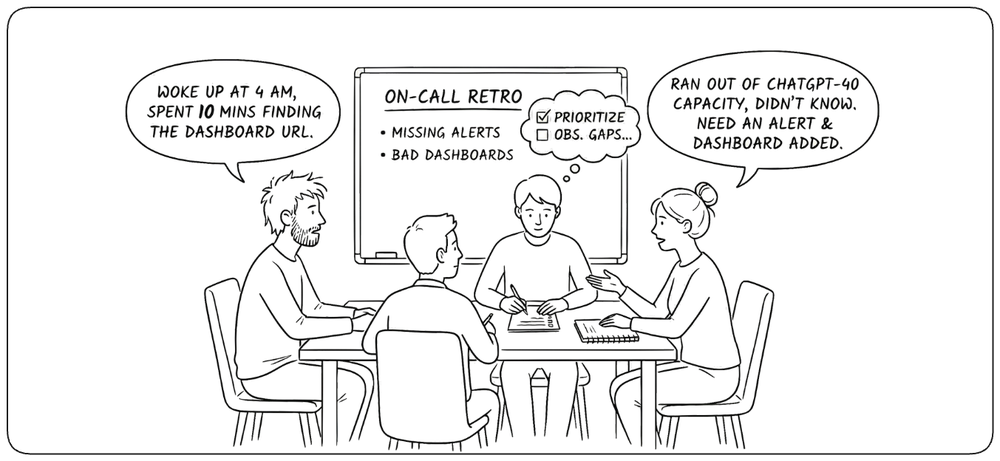
On-Call Rotation Retrospectives: Capturing Observability Gaps [On-Call Retrospectives]
On-call retrospectives capture recurring operational friction that individual incident reviews may miss. At the end of each rotation, teams should identify repeated investigation difficulties, noisy alerts, missing entry points, and manual work while the experience is still fresh. These patterns should become prioritized improvements, so each rotation leaves the system a little easier to operate.
Investigation Is a Skill [Investigation Skill]
Observability tools reveal signals; investigation turns them into understanding. This skill is not born with the engineer—it is built over time, incident after incident, by asking sharper questions, forming hypotheses, ruling them out with evidence, and knowing when to zoom out. Teams that treat investigation as a craft develop shared reflexes: where to look first, which dimensions to slice, how to read a timeline, when a coincidence is not a coincidence. The best observability platform in the world produces little value without engineers trained to interrogate it—and this same skill is what makes the next generation of AI-assisted investigation genuinely useful.

How AI Is Changing Observability [AI & Observability]
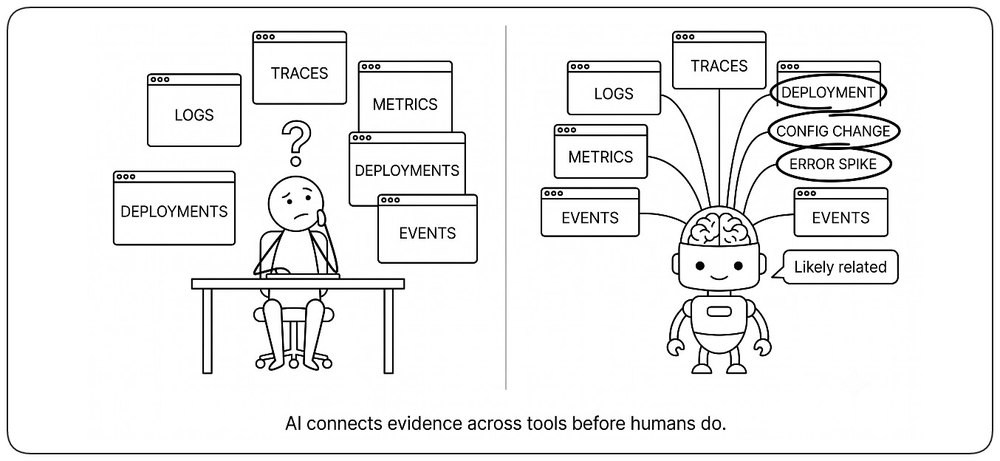
AI is changing observability by making investigation faster and more accessible. It can connect evidence across tools, translate natural-language questions into queries, suggest likely causes, and assemble incident timelines as events unfold. These capabilities do not replace engineering judgment; they amplify the value of the telemetry already available.
Cross-Source Correlation [AI Correlation]
AI can correlate evidence across logs, traces, metrics, deployments, configuration changes, dependency incidents, and business events far faster than humans can. Instead of manually pivoting from one tool to another, engineers receive likely relationships and hypotheses immediately. AI does not replace investigation—it accelerates it by connecting evidence that would otherwise remain scattered.
Natural Language Investigation [Natural Language]
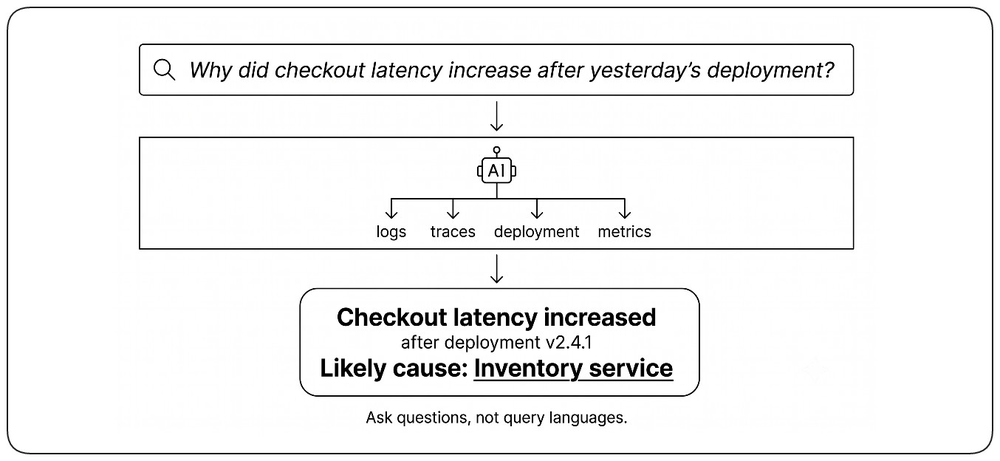
Observability should not require learning complex query languages. AI allows engineers to investigate systems using natural language: “Why did checkout latency increase after yesterday’s deployment?” or “Show me all failed requests for European users after version 2.4.1.” The goal is not to replace structured queries, but to make evidence accessible to a wider range of engineers.
AI as an Investigation Assistant [Investigation Assistant]
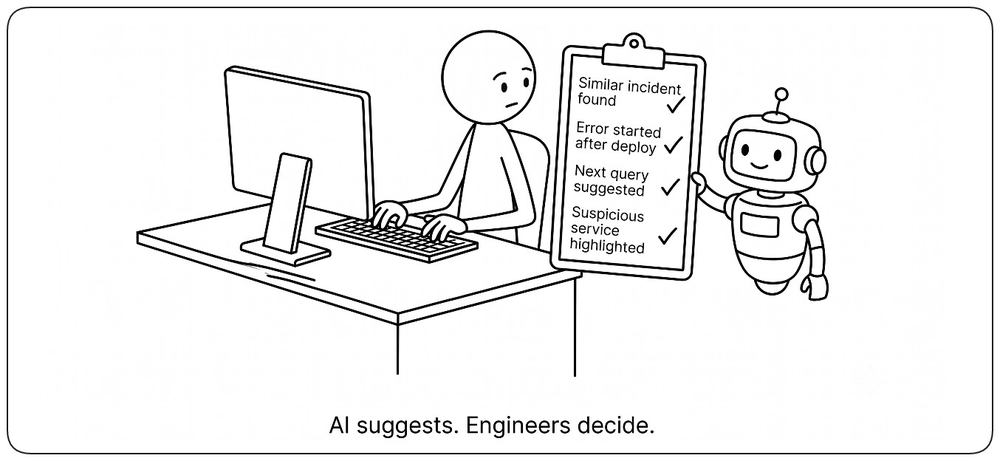
Modern observability platforms increasingly use AI as an investigation assistant rather than a decision maker. It summarizes logs, highlights unusual traces, identifies suspicious changes, suggests the next query to run, and explains why a particular hypothesis is worth investigating. Engineers remain responsible for validating conclusions, but they spend less time searching and more time reasoning.
AI as the First Responder [First Responder]
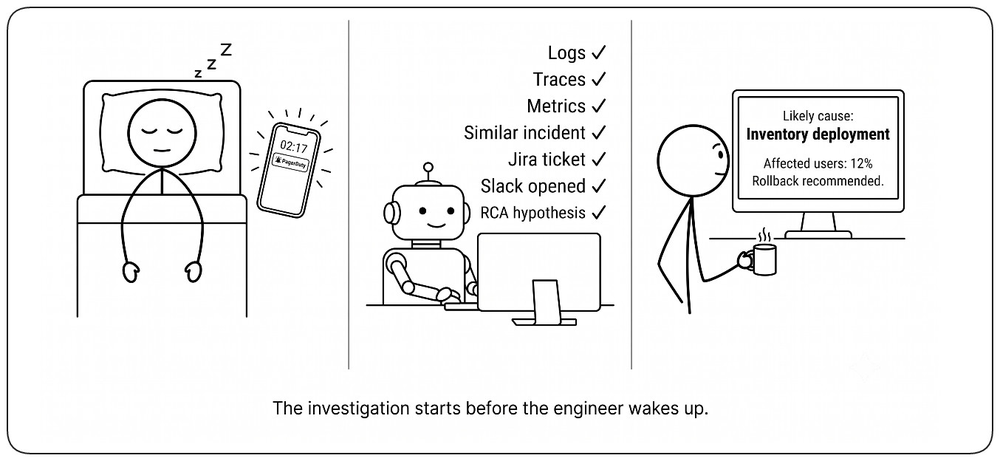
Modern incident response increasingly begins with AI before a human even joins the investigation. As soon as an alert fires, AI can correlate telemetry, identify likely root causes, assess user impact, search for similar incidents, generate an initial diagnosis, open incident tickets, notify the appropriate teams, and recommend or even trigger predefined remediation steps. When the on-call engineer wakes up, the investigation is already underway. Humans remain responsible for decisions, but they no longer start from a blank page—humans investigate today, humans supervise tomorrow.
AI-Generated Post-Mortems [AI Post-Mortems]
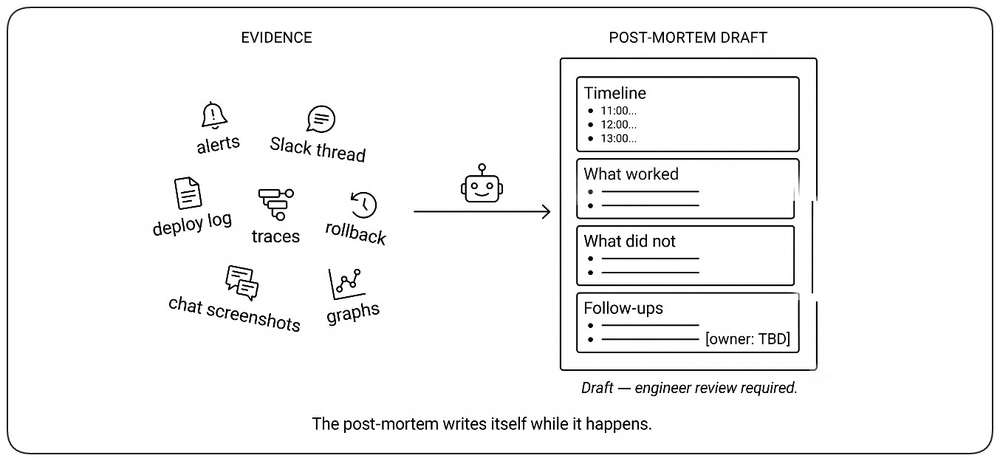
Once an incident is resolved, AI can assemble the post-mortem draft from the evidence it already collected during the response. It reconstructs the timeline, identifies the contributing factors, describes what worked and what did not, highlights delays in detection or diagnosis, and proposes concrete follow-up items such as missing alerts, absent instrumentation, or unclear runbooks. Engineers refine and validate the narrative, but they no longer start from blank pages, scattered chat logs, and half-remembered timestamps. The post-mortem becomes a shared artifact produced with the AI, not after the fact.
Every Investigation Improves the Next One [Investigation Loop]
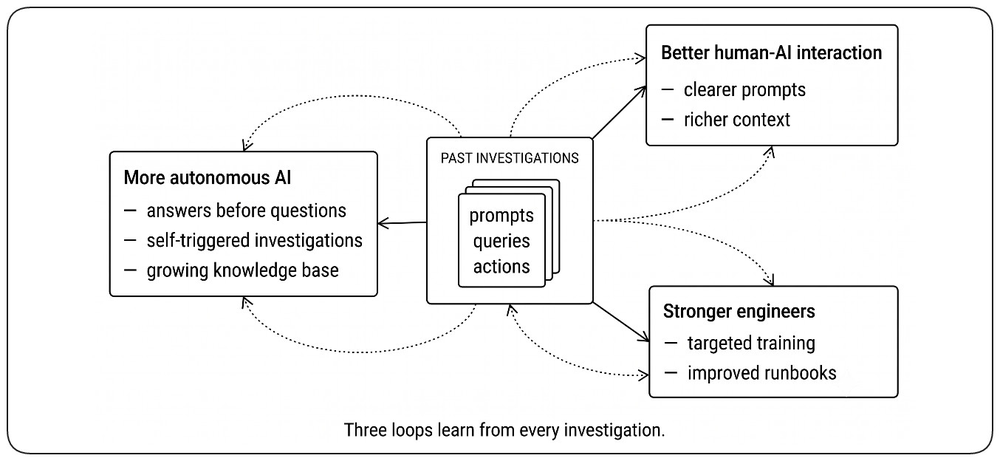
The prompts, questions, and actions engineers use during an incident are themselves valuable telemetry: the investigation itself becomes observable. Captured over time, this record enables three distinct improvement loops. First, engineers learn how to collaborate with the AI more effectively—asking better questions, framing better prompts, and using its capabilities more fully. Second, teams identify blind spots in their understanding of the system and turn them into targeted training or better runbooks. Third, the AI itself becomes progressively more autonomous, building a knowledge base from past interactions so it can anticipate questions, propose investigations before they are requested, and reach initial conclusions on its own. Investigation stops being a one-shot activity and becomes a continuously improving practice.
Observing Team Maturity Over Time [Operational Maturity]
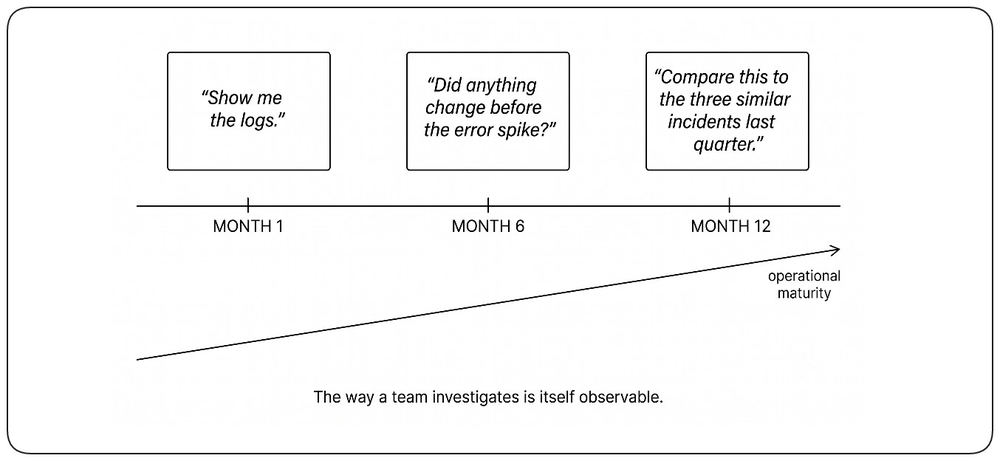
When investigation prompts are captured across months and years, they reveal something the system itself never could: how the team is evolving. Early prompts tend to be exploratory—"show me the logs", "did something change?" Over time, they become more specific, more contextual, more strategic—"compare this incident to the three similar ones this quarter", "why did our rollback take longer than the last two?". This progression is a measurable signal of operational maturity. Teams and their leaders can finally see how their investigation practice improves, where it stagnates, and where deliberate coaching is needed. Observability starts to include the humans operating the system, not only the system itself.
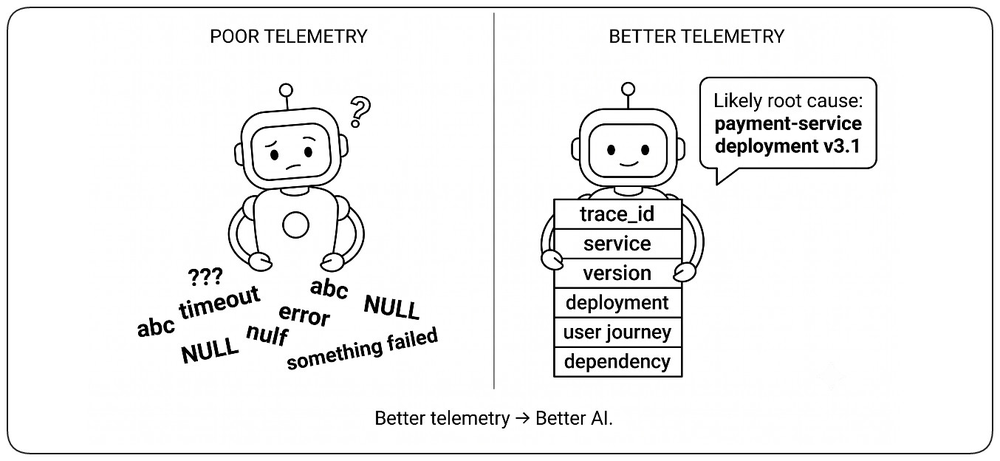
AI Depends on High-Quality Observability [AI Needs Evidence] {1}
AI can only reason from the evidence it receives. Missing traces, inconsistent identifiers, unstructured logs, or incomplete events lead to incomplete or misleading conclusions. !!The quality of AI-assisted operations is determined by the quality of the observability platform beneath it.!! Better telemetry produces better reasoning. AI amplifies observability—it cannot replace it.